Chapter 1 — Who Lives Here
The income composition of Stockbridge has changed dramatically in the last decade. The town’s other demographic indicators — age, education, household size — all point in the same direction. Stockbridge is a small, older, well-educated, and increasingly affluent year-round community embedded in a much larger seasonal one.
A quick note on what these numbers mean
When this profile talks about the “median” household income, it means the middle of the road — the household that’s richer than half the town and poorer than the other half. A household is everyone who lives together at one address, with all their incomes added up. The income includes wages from work, retirement payments, Social Security, and other regular income. The middle-of-the-road household is a better gauge of how most people live than an average would be — averages get pulled way up by a few very wealthy households, especially in a town like Stockbridge.1
The income transformation
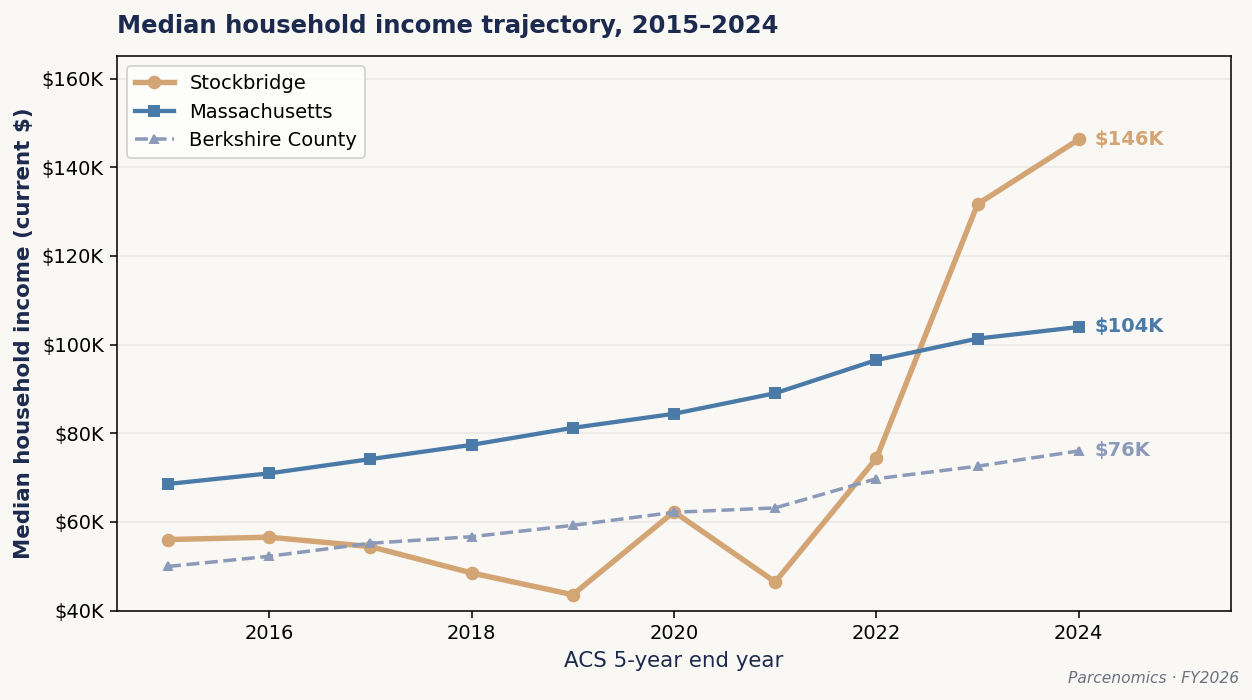
In 2015, the middle-of-the-road Stockbridge family earned $56,027. In 2024, that family earned $146,250. Even after accounting for inflation — the fact that everything costs more now than it did then — the middle-of-the-road Stockbridge family nearly doubled its purchasing power in nine years.2
To put what that change looks like on the ground: in 2015, the middle-of-the-road Stockbridge family could afford a new Honda Civic — a practical, reliable family car. The middle-of-the-road Stockbridge family in 2024 could afford a new Beamer — roughly three times the price, and a different kind of car for a different kind of buyer. Same position in town. Different town.
Across Massachusetts, the typical middle-of-the-road family saw its purchasing power rise by about 15% over those same nine years. Berkshire County traveled at the state pace. Stockbridge’s middle family went somewhere else entirely. Roughly six times further than the state.
The Stockbridge figure is not the result of existing families getting richer. It is the result of who lives in Stockbridge changing. As home prices and rents rose, middle-income families moved out. Higher-income families moved in. The magnitude of that replacement is examined later in this chapter.
Per-person income in Stockbridge is now $84,995 — 1.47 times the Massachusetts average of $57,897. Federal census estimates for towns under 5,000 in population carry meaningful uncertainty around their point values. The pattern across multiple indicators holds nonetheless.
A small town that’s getting older
Stockbridge has 2,056 residents in 23.8 square miles. Population density is 86 people per square mile — about three-fifths the Berkshire County average and one-tenth the Massachusetts average. This is a small town in a sparse county in a dense state.
The middle of the road for age is 63.7 years in Stockbridge. The Berkshire County figure is 47.3. The Massachusetts figure is 40.0. Stockbridge is 16 years older than the county and 24 years older than the state.
The town’s active voter file — 1,600 registered voters who voted in at least one recent election, as of April 2026 — gives the clearest and most current picture of the adults who actually vote in Stockbridge. Of those active voters, 54.3% are 65 or older. Only 10.8% are 18 to 34. The single largest group is age 65 to 74, with 26.3% of active registrations.
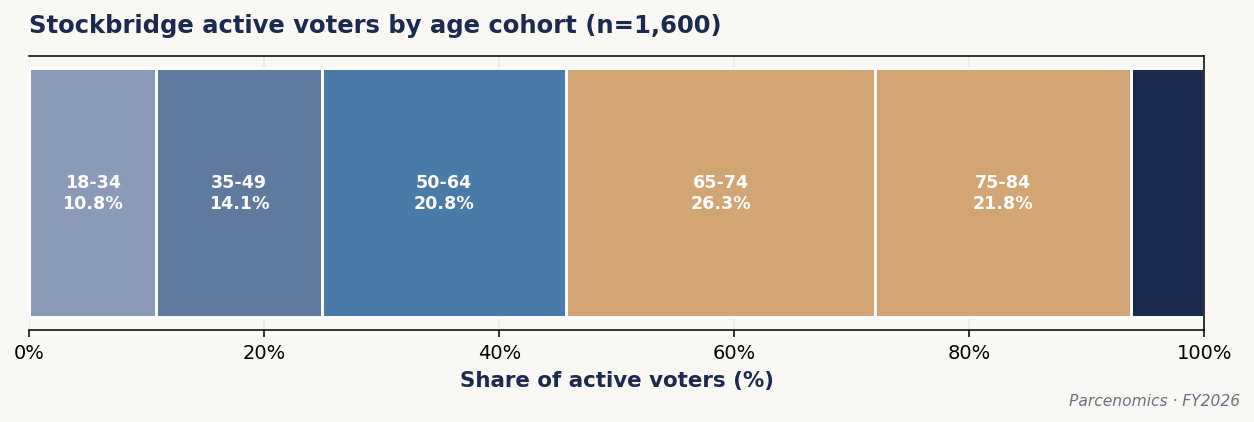
For comparison, the Massachusetts share of adults that is 65 or older is roughly 25%. Stockbridge’s 54.3% is roughly twice that. This is the demographic signature of a retirement-skewed community.
Education and household composition
Sixty-two percent of Stockbridge adults age 25 and over hold a bachelor’s degree or higher.3 Berkshire County’s rate is 40.0%. The Massachusetts rate is 47.3%. Stockbridge’s college-attainment rate is well above both.
This is consistent with the income picture. The households arriving in Stockbridge over the last decade are educated professionals and retirees from professional careers.
The town’s owner-occupancy rate among year-round households — the share of homes where the owner lives in the home rather than renting it to someone else — is 83%. The white-non-Hispanic share of the population is 97%. Both figures move with the median age and median income: older, more affluent, and more demographically homogeneous than the Berkshire or Massachusetts averages.
Stockbridge in Berkshire context
Across the standard demographic indicators, Stockbridge does not cluster with the Berkshire County average. It clusters with the highest-end Berkshire seasonal communities.
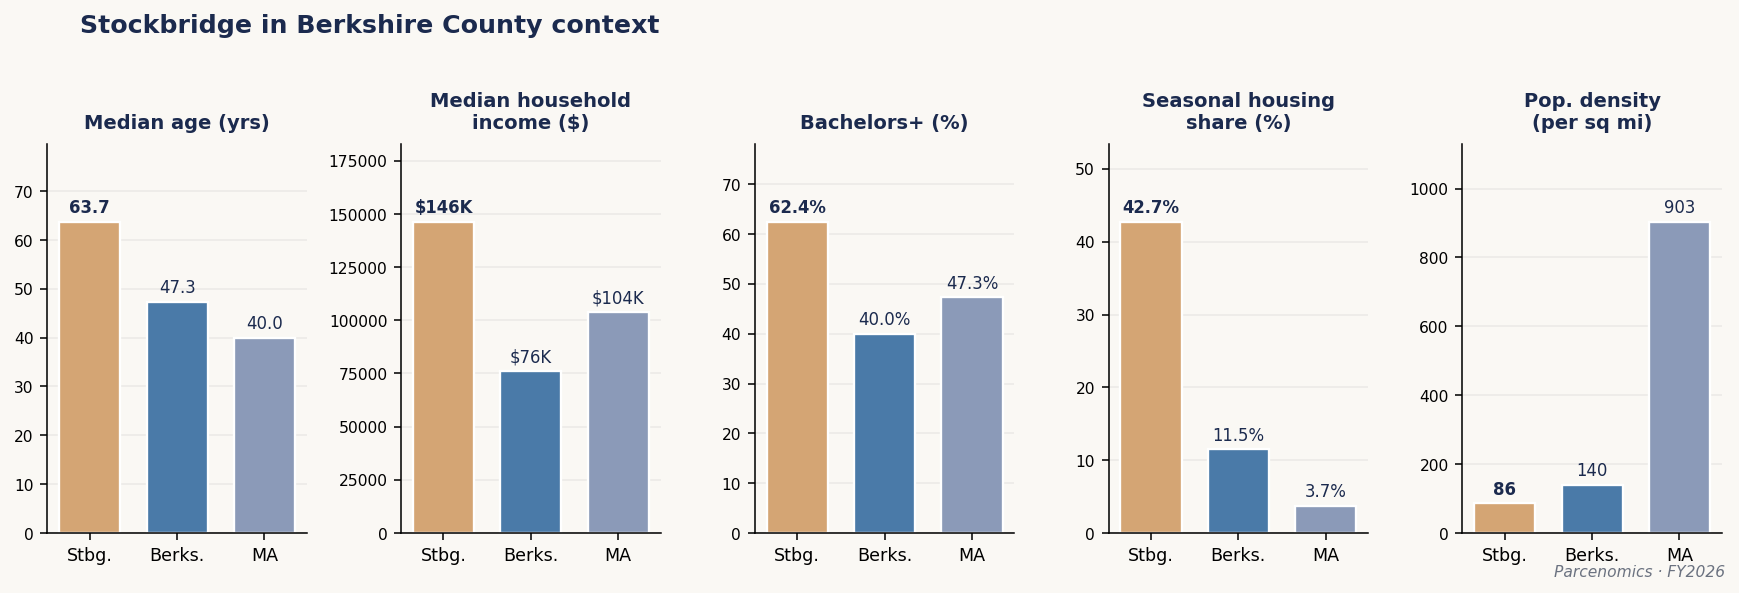
Stockbridge was one of the original eight Berkshire towns named in the Commonwealth’s December 2024 designation of Seasonal Communities under the 2024 Affordable Homes Act. The Commonwealth’s list has since expanded to include 18 Berkshire municipalities — those with elevated seasonal-housing share, second-home concentration, or short-term rental intensity. Chapter 4 returns to this pattern in detail.
Who’s buying in
The data so far describes where Stockbridge is. The next question is where the road leads. The most direct indicator is the rate at which recent property buyers become full-time year-round residents.
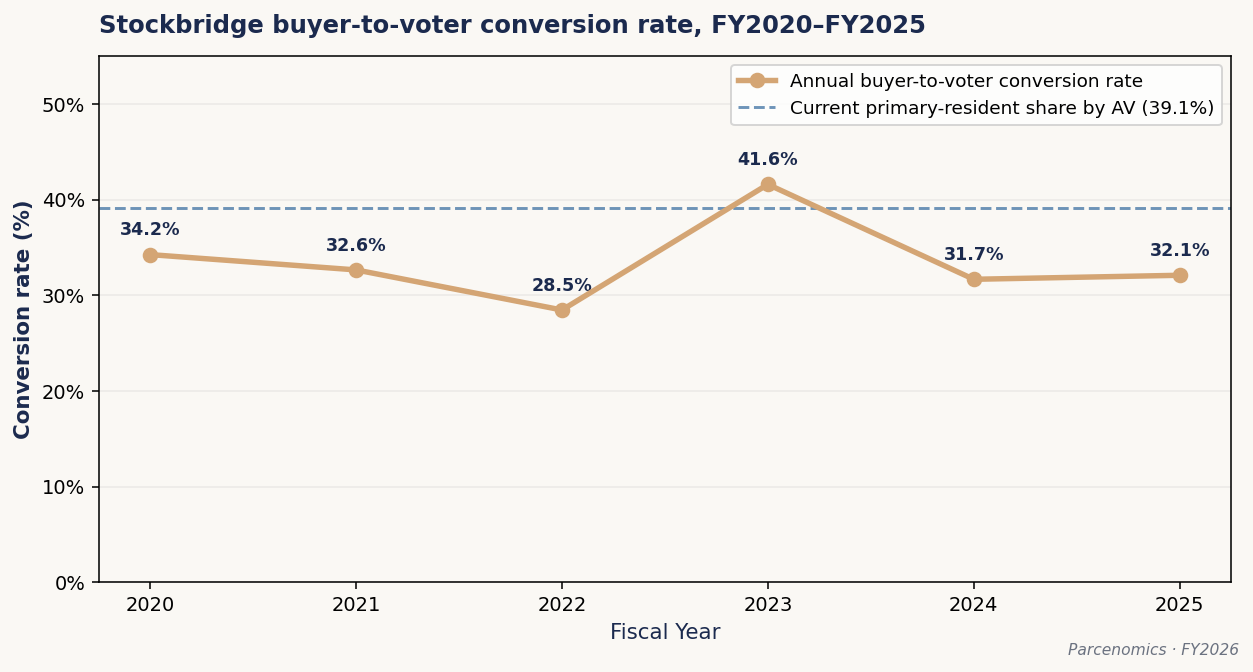
Between FY2020 and FY2026, Stockbridge recorded 794 residential property sales. Of those buyers — whether named as individuals or through legal entities like LLCs and trusts — 29.5% became Stockbridge voters at the purchased property’s address. Limiting to the most recent four fiscal years (FY2023–FY2026), the rate is 25.3%.4
The current primary-resident share of residential property by assessed value is 39.1%.5 Recent buyers are converting to year-round residents at a meaningfully lower rate than the share of property that currently has a primary resident. Each property turnover, on average, replaces a year-round-residence household with substantially less than one. Over time, the year-round community shrinks as a share of who owns property in Stockbridge.
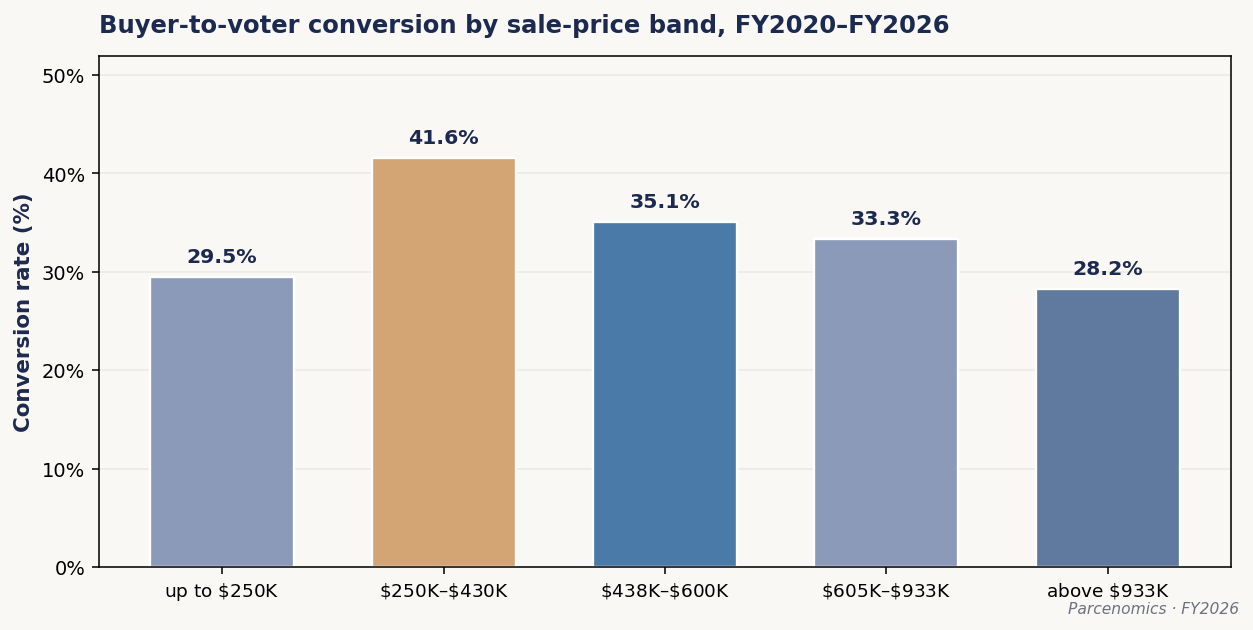
The conversion rate varies meaningfully by sale price. Sales were sorted from cheapest to most expensive and divided into five equal-count price bands. Lower-priced properties (up to $250,000) convert at 29.5%. The middle-priced band ($250,000 to $430,000), which is the price range accessible to working professionals, converts at 41.6% — the highest of any band. The high-end second-home band (above $940,000) converts at 28.2%. The pattern is consistent with what national resort-market research documents: middle-priced housing produces year-round residents at the highest rate, and high-end housing produces them at the lowest.
The replacement math
The buyer-conversion picture and the income-shift picture connect through a simple arithmetic. Between FY2020 and FY2026, sales of residential property in Stockbridge affected the year-round household population in four distinct ways.6
Some sales moved a property from one year-round family to another year-round family — a household replacement that left the year-round community the same size. Some sales moved a property from a year-round family to a non-resident buyer — a household departed the year-round community. Some sales moved a property from a non-resident owner to a year-round family — a household joined the year-round community. And some sales moved a property from one non-resident owner to another — sales that did not affect the year-round community on either side.
Sorting the sales register by these four categories: between FY2020 and FY2026, 234 year-round families joined the Stockbridge community through property purchases, and 244 year-round families departed it. The net change in the year-round household count over seven years was negative 10 — essentially flat.
The implication is forceful. For Stockbridge’s overall middle-of-the-road income to have nearly doubled in purchasing power while the year-round community changed in count by only 10 families over seven years, the arriving families must earn dramatically more than the families they replaced. There is no other explanation. If the families that stayed in Stockbridge tracked the statewide pace of income growth — which is what would be expected — the arriving families earned approximately $268,000, in comparable dollars. That is roughly 3.15 times what the departing families earned.
This is the composition shift quantified. The town did not get richer because its families got richer. The town’s families were largely replaced by other families, and the new ones earn three times what the ones they replaced earned. Same position in town. Different town.
“234 families joined. 244 families left. Net change: 10. Income shift: roughly threefold.”
What this profile is built on
The demographic figures in this chapter come from the U.S. Census Bureau’s American Community Survey 2020-2024 5-year estimates — the federal version current as of mid-2025, with 2015 figures from the 2011-2015 5-year estimates for the income comparison. The voter age distribution is from Stockbridge’s town voter file, snapshot dated April 21, 2026, filtered to active registrations with a known birth year. The buyer-to-voter conversion analysis matches buyer names against the voter file using a process that handles nicknames, spelling variants, and middle-name differences; conversion is measured at the purchased property’s address rather than against any in-town registration. Entity buyers (LLCs and trusts) are included in the analysis via situs-match — a parcel purchased by an entity is counted as converted if a current voter is registered at that parcel’s address. Each input is conservative. Small-town federal estimates carry meaningful uncertainty around their point values. Automated name-matching misses fuzzy variants that hand review would catch. Some seller residency at the time of sale could not be determined and was flagged accordingly. Full methodology is in the Technical Appendix.
Footnotes
- Median household income figures are from the U.S. Census Bureau, American Community Survey 5-year estimates, table B19013. Stockbridge: 2011-2015 vintage and 2020-2024 vintage. Massachusetts and Berkshire County figures from the same source and vintages. ↩
- The middle-of-the-road Stockbridge household earned $56,027 in 2015 and $146,250 in 2024 — a 2.61-times increase in current dollars. Adjusted for the 32% rise in the Consumer Price Index between 2015 and 2024 (Bureau of Labor Statistics CPI-U, U.S. city average, annual), the equivalent purchasing-power growth is approximately 1.97 times. Massachusetts grew 1.52 times in current dollars over the same period, equivalent to roughly 1.15 times in purchasing-power terms. Berkshire County grew at the state pace. Stockbridge’s purchasing-power growth was approximately six times larger than the state’s. The arithmetic of comparable proportional gains across the two geographies is invariant to inflation adjustment, since the same price-level multiplier applies to all figures; the choice of presentation affects the headline only, not the comparison. ↩
- Education and household-composition figures from ACS 2020-2024 5-year, tables B15003 (educational attainment) and B25003 (tenure / owner-occupancy). ↩
- Conversion analysis universe: residential parcels (assessor classes 101, 102, 103, 104, 105, 109) sold to any buyer (individual or entity) between FY2020 and FY2026. Vacant land sales (classes 130-132, 106) excluded. Conversion is measured by matching buyer names and parcel situs addresses against the Stockbridge voter file. The canonical name layer handles nickname variants, spelling differences, and middle-name discrepancies. Entity buyers (LLCs and trusts) are counted as converted if any current voter is registered at the purchased parcel’s address. See Technical Appendix for canonical name layer methodology and override logic. ↩
- Primary-resident share of residential property by assessed value is computed using the residency tier classifier (class-aware, with manual overrides). Methodology is documented in Chapter 2 and the Technical Appendix. ↩
- Implied newcomer income is calculated from the observed Stockbridge middle-of-the-road income shift ($56,027 in 2015 to $146,250 in 2024), the statewide pace of growth (1.52 times in current dollars), the four-category sale filter (Resident-to-Resident, Resident-to-Non-resident, Non-resident-to-Resident, Non-resident-to-Non-resident — distinguished by residency status of seller at time of sale and buyer post-sale), and the count of household-affecting sales between FY2020 and FY2026. The math is in current dollars throughout; because every term uses the same dollar convention, the resulting inferred newcomer income figure of approximately $268,000 is in 2024 dollars — directly comparable to the 2024 Stockbridge middle-of-the-road income. See Technical Appendix for full derivation and sensitivity analysis. ↩