Chapter 3 — How We Got Here
Chapter 2 described what Stockbridge’s tax base looks like today: residential-dominant, value-concentrated, commercial-limited, with substantial exempt institutions outside the levy. This chapter traces how that picture came to be. Sixteen years of fiscal data show that the structural features of Stockbridge’s current tax base are not recent developments. They are the cumulative product of three trends operating in parallel: residential property growing faster than commercial, commercial new growth experiencing a categorical step-change after the pandemic, and excise revenue partly compensating for the commercial gap through deliberate policy action rather than market growth.
The revenue picture, from the state’s own dashboard
Before tracing the tax-base mechanics, it is worth establishing the shape of Stockbridge’s revenue over the same window from an independent source: the Massachusetts Department of Revenue’s Municipal Finance Trend Dashboard, which publishes a standardized revenue-by-source series for every municipality in the Commonwealth. The dashboard tells the same story this chapter develops in detail, in three numbers.
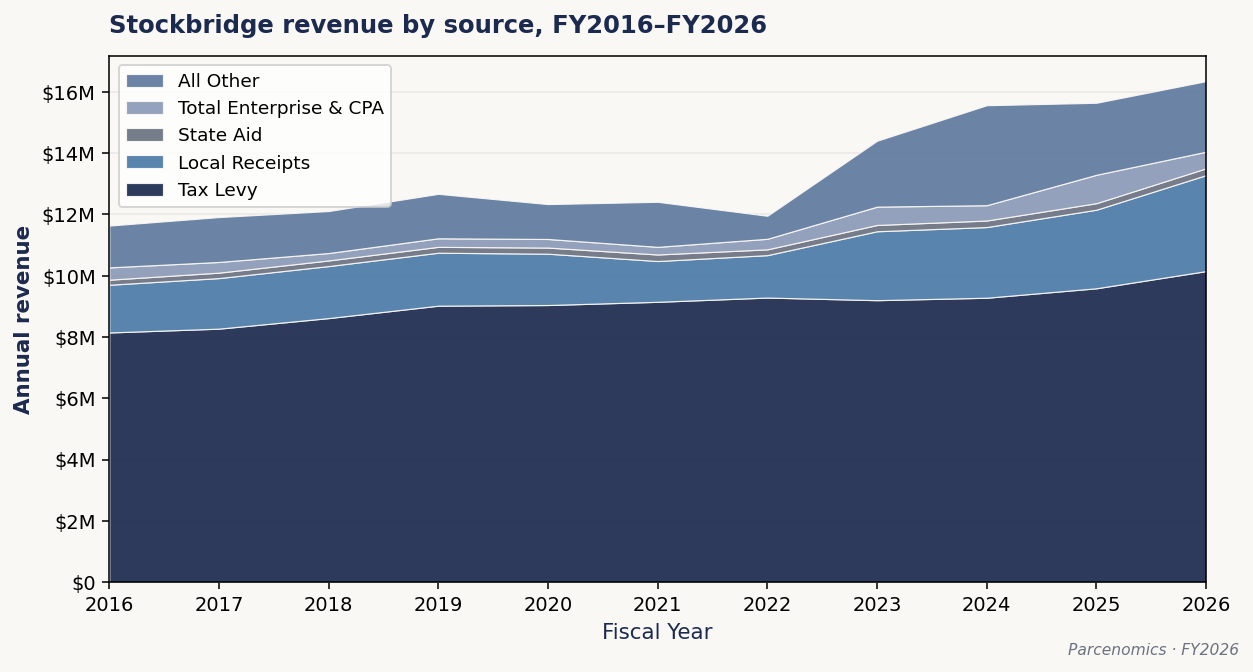
Three patterns in the state’s published revenue series frame everything that follows:
- State aid has been essentially flat. Stockbridge’s state aid moved from approximately $164,956 in FY2016 to approximately $222,446 in FY2026 — a nominal increase of about 35% over a decade, which after inflation represents roughly flat-to-declining real purchasing power. State aid has not kept pace with the Town’s rising obligations, leaving locally-raised revenue to carry the growth.
- The tax levy has climbed steadily. The levy grew from approximately $8.15 million in FY2016 to approximately $10.15 million in FY2026 — the steady, mechanical climb of Proposition 2½’s 2.5% annual baseline, with no override breaking the pattern. This is the levy doing the work that flat state aid did not.
- Local receipts have roughly doubled in the back half of the window. Local receipts moved from approximately $1.56 million in FY2016, dipped to approximately $1.33 million in FY2021, and then climbed to approximately $3.13 million by FY2026. The inflection — flat-to-declining through 2021, then a steep climb — is the rooms-and-meals-and-excise story this chapter documents in its final section, visible in the aggregate revenue data before any of the potential new-growth projects Chapter 4 discusses have broken ground.
The DOR dashboard figures are presented here as independent corroboration of the tax-base mechanics that follow. Where a dashboard figure and the certified FY2026 LA-4 Recap differ (the dashboard refreshes on a different schedule than the Recap is certified), the locked per-scenario figures elsewhere in this profile are sourced from the LA-4; the dashboard series is used for the multi-year shape, not for the locked single-year constants.
Residential pulling away from commercial
Over the sixteen-year window from FY2011 to FY2026, residential property in Stockbridge appreciated faster than commercial property — and the gap compounded into a meaningfully different tax base shape by the end of the window.
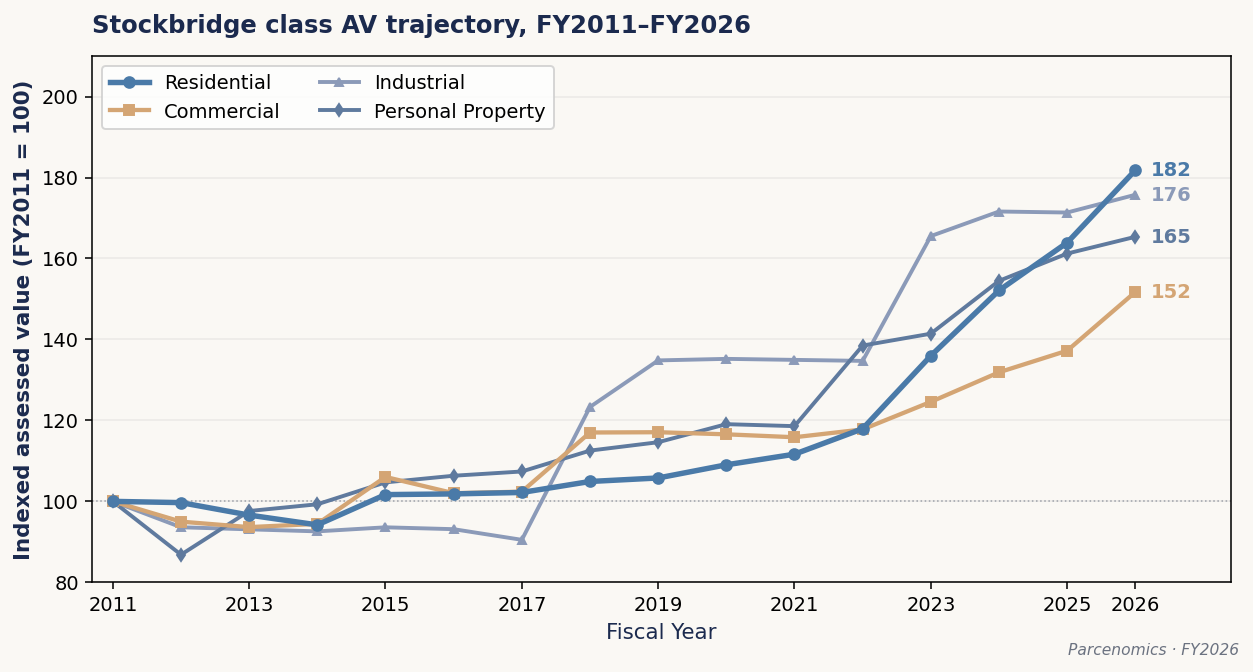
Residential class assessed value grew from $749 million in FY2011 to $1.36 billion in FY2026 — a cumulative growth factor of 1.82, or an annualized rate of 4.07% per year.1 Commercial class assessed value grew from $46.3 million to $70.3 million over the same window — a cumulative factor of 1.52, or 2.82% per year. Industrial grew at 3.83% per year, faster than commercial; personal property at 3.41%. Commercial was the slowest-growing class over the period by a meaningful margin.
| Property class | FY2011 AV | FY2026 AV | Cumulative growth | CAGR |
|---|---|---|---|---|
| Residential | $749.2M | $1,362.0M | 1.82× | 4.07% |
| Industrial | $3.8M | $6.7M | 1.76× | 3.83% |
| Personal property | $34.0M | $56.2M | 1.65× | 3.41% |
| Commercial | $46.3M | $70.3M | 1.52× | 2.82% |
The compounding effect across sixteen years matters more than the year-by-year difference. A 1.25 percentage point annual CAGR gap (4.07% vs. 2.82%) does not sound dramatic in any single year. Over sixteen years it produces the divergence the chart makes visible: by FY2026, residential has grown 1.82×, while commercial has grown 1.52×. That gap is what positioned Stockbridge’s tax base for the post-pandemic acceleration that followed.
The independent DOR dashboard series confirms this divergence from the state’s own assessed-value records: the dashboard’s residential/open-space class grew from approximately $762.9 million in FY2016 to approximately $1.362 billion in FY2026 (a 79% increase over the decade), while the commercial/industrial/personal-property class grew from approximately $86.9 million to approximately $133.2 million (a 53% increase) over the same period.1a The residential base carried the appreciation; the commercial base did not.
Most of the residential acceleration concentrated in a three-year window. Residential AV moved from $836 million in FY2021 to $1.14 billion in FY2024 — a 28% increase over two assessment cycles, reflecting the post-pandemic Berkshire real estate market translating into assessed values. Commercial AV moved only modestly over the same window, from $54 million to $61 million.
The structural consequence for the tax base composition: residential’s share of the total taxable base grew from approximately 90% at the start of the window to 91.1% at the end. That sounds like a small shift but conceals the magnitude of the underlying movement, because both the numerator (residential) and the denominator (total taxable base) were growing. The fact that residential’s share rose at all despite a denominator that included PPT growing at 3.41% and industrial at 3.83% means residential was outpacing those classes too.
The commercial new-growth step-change
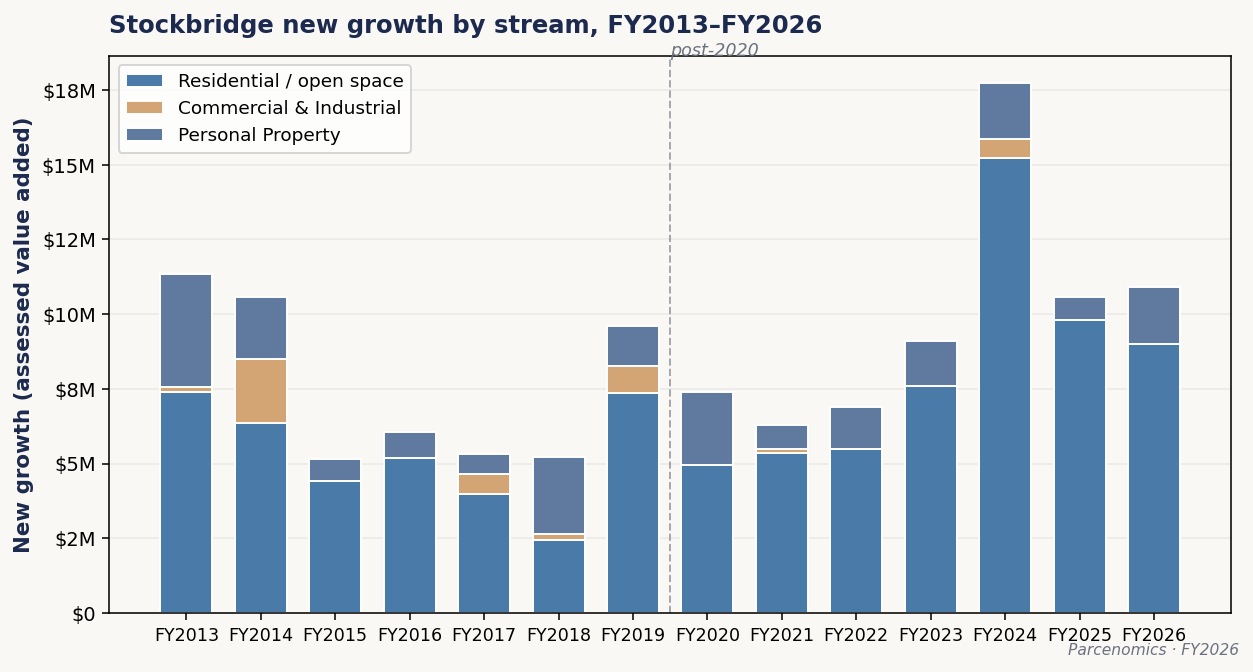
The class AV trajectory in the prior section measures the growth of all property within each class — existing buildings appreciating, plus new construction, plus reassessment. New growth under Proposition 2½ is a narrower measure: only newly-added taxable property, the kind that permanently expands the Town’s levy limit dollar-for-dollar without a voter override. New growth is the principal mechanism by which Massachusetts towns can fund new spending without raising rates on existing taxpayers.
Over the seven years from FY2013 to FY2019, commercial and industrial property contributed $4.1 million in cumulative new growth to Stockbridge’s tax base. Six of those seven years showed non-zero C&I new growth; only FY2016 was at zero. Residential added $37.1 million over the same window. The pre-pandemic ratio: about 9 dollars of residential new growth for every 1 dollar of C&I new growth.
Over the seven years from FY2020 to FY2026, C&I new growth was $749,000 cumulatively — less than one-fifth of the pre-pandemic figure. Five of those seven years showed zero C&I new growth: FY2020, FY2022, FY2023, FY2025, and FY2026. Only two years showed any C&I activity at all, and the two together accounted for less than a million dollars. Residential added $57.4 million over the same window — itself a 55% increase over the pre-pandemic residential pace. The post-pandemic ratio is 77 dollars of residential new growth for every 1 dollar of C&I.2
| Window | Residential / open space | C&I | Ratio |
|---|---|---|---|
| Pre-pandemic (FY2013–FY2019) | $37.1M | $4.1M | 9 : 1 |
| Post-pandemic (FY2020–FY2026) | $57.4M | $0.75M | 77 : 1 |
The shift is categorical, not gradual. Pre-pandemic, C&I new growth was small but functioning — six of seven years produced something. Post-pandemic, C&I new growth is essentially zero in most years. The mechanism is the most consequential structural feature of Stockbridge’s tax base trajectory: the main way Proposition 2½ towns grow their levy without raising rates — adding new commercial property — has effectively closed for Stockbridge. Without commercial new growth, levy limit expansion depends entirely on residential development — which has continued, but in a small town with limited buildable residential capacity, residential new growth alone cannot indefinitely compensate for the commercial nullity.
This is the structural pattern that makes potential commercial development the question Chapter 4 takes up. If new projects of meaningful scale reach construction in the next several years, they would represent the first significant commercial new growth in Stockbridge in roughly a decade.
The state’s measurement system has been lagging
Massachusetts requires local assessors to value property annually based on recent sale prices. The state Department of Revenue separately produces an Equalized Valuation (EQV) for every municipality every two years — an independent estimate of total market value used for state aid distribution and, critically for Stockbridge, for the school capital cost formula under the 2017 amended BHRSD regional agreement.
Stockbridge’s local assessments have been well-calibrated against the state’s biennial EQV throughout the 16-year window. In each of the eight biennial cycles from 2010 through 2024, the ratio of Stockbridge’s CAMA total to its DOR-certified EQV fell between 95% and 99% — comfortably within the state’s 90-110% certification band.3
What changed in the post-pandemic period is not the calibration but the lag. The state’s biennial EQV is, by design, a measurement from two years prior. When Stockbridge’s local CAMA total moved sharply upward in FY2022, FY2023, and FY2024 — reflecting the post-pandemic market — the corresponding state EQV figures were measuring market conditions from one or two cycles back. The result is the divergence Chapter 2 noted: Stockbridge’s FY2026 CAMA of $1.495 billion against the most recent published EQV (FY2024) of $1.311 billion produces an implied ASR of 114.1%.
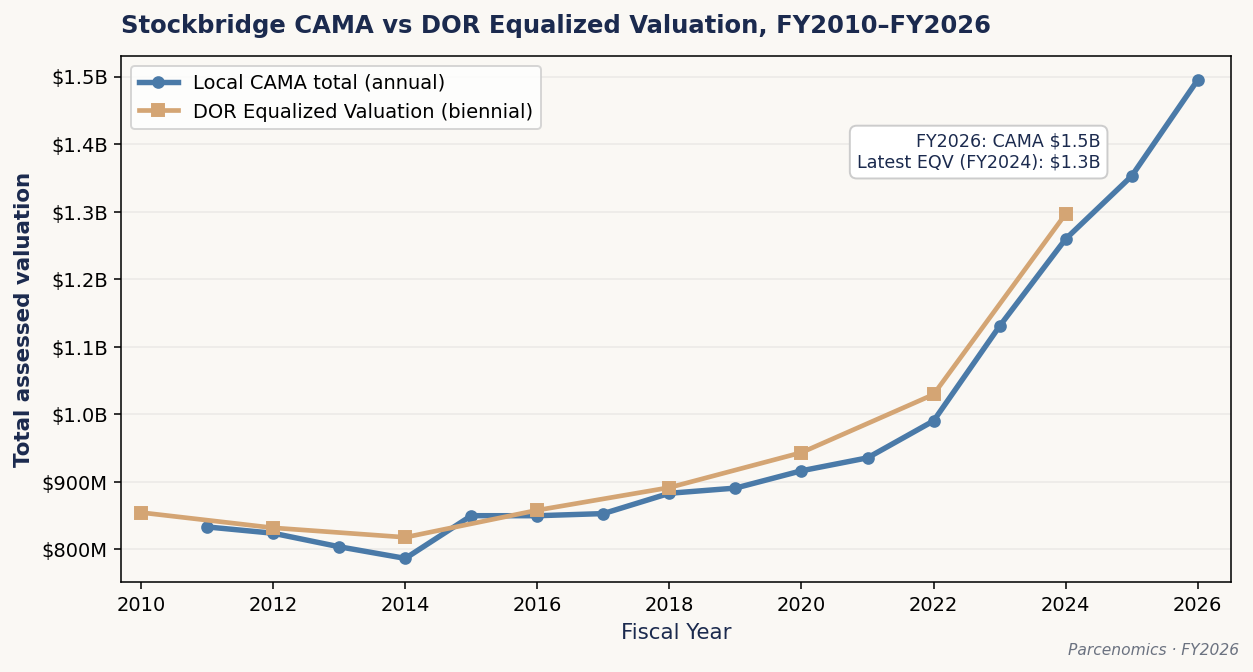
That implied 114.1% figure is not a measurement failure. It is the result of comparing the most recent local CAMA (FY2026) against the most recent published EQV (FY2024), which is now stale. The next EQV cycle — FY2026 EQV, scheduled for late 2026 publication — will substantially close the gap by reflecting two more years of actual sales activity. Stockbridge’s local assessors have been doing their job. The state’s biennial measurement system simply was not designed to track the velocity of post-pandemic resort-market appreciation in real time.
The consequence for the BHRSD school capital obligation is documented in this profile’s executive summary. The capital share lock-in operates on the EQV in effect at the November 2025 School Committee authorization vote — the FY2024 EQV of $1.311 billion. By the time Stockbridge actually begins servicing its share of the bond, Stockbridge’s true market value will be meaningfully higher than the locked basis suggests. The 30-year obligation is calculated against a measurement of Stockbridge wealth that was already two years out of date when it was locked.
The next commitment in the pipeline
The lagging-EQV mechanism documented above is not specific to the BHRSD capital obligation. It applies to every long-duration municipal commitment Stockbridge enters under the current measurement regime. The next commitment of comparable magnitude is already moving from planning into implementation.
In December 2024, Stockbridge and West Stockbridge voters approved a joint fire-and-EMS operation, target operational date July 1, 2027. The plan replaces Stockbridge’s current fire-only municipal department and its current EMS arrangements — paid shared-services contracts with the Town of Lee (covering most of Stockbridge) and the Town of Lenox (covering the Stockbridge Bowl area), and at-no-cost regional coverage by the Southern Berkshire Ambulance Squad in the Furnace District and the southern portion of Stockbridge near Housatonic. Under the joint arrangement, a new fire/EMS station will be built on West Stockbridge Road near Routes 102 and 183, owned by the Town of Stockbridge, with staff and operations shared between the two municipalities on a 60% Stockbridge / 40% West Stockbridge cost split.4
The capital cost of the new station is estimated at approximately $5.27 million, debt-financed at 3.5% over 20 years, producing annual debt service of approximately $354,000. Operating costs of the joint operation are projected at approximately $1 million annually at full staffing — 1 full-time chief, 2 deputies, and 8 fire/EMS professionals — with Stockbridge’s 60% share at approximately $600,000. Two ambulances are budgeted as part of the project: $280,000 for an initial unit and $450,000 for a transitional unit. The project is being funded through the operating budget rather than a debt exclusion. The FY27 Stockbridge operating budget approved by the Select Board in April 2026 reflects a 4.7% increase ($627,000) that absorbs the first stages of fire/EMS expansion. Free cash reserves are projected to cover the first three years of debt service.
The same EQV-calibration mechanism that applied to the school capital lock-in will apply to whatever long-duration municipal debt Stockbridge enters in connection with the joint operation. The EQV in effect at the relevant authorization vote will set the basis on which Stockbridge’s wealth is measured for state-aid distribution and intergovernmental cost-sharing formulas over the life of the debt. The structural pattern is the same one the BHRSD lock-in already demonstrated: a long-duration commitment calibrated against a wealth measurement that may already be out of date when the commitment is made.
The combined annual incremental burden of the BHRSD capital share and the joint fire/EMS operation will compound over the next several fiscal years as both commitments come into full effect. The fiscal-tools analysis in Chapter 5 is calibrated against pressures of this magnitude.
Excise revenue and the lever that worked
The class AV and new-growth trajectories above describe the structural features of Stockbridge’s tax base. Property tax is not the only fiscal lever the Town has, however. Massachusetts permits local-option excise taxes on lodging (rooms tax) and on restaurant meals — revenue streams that flow outside the Proposition 2½ levy limit as local receipts.6
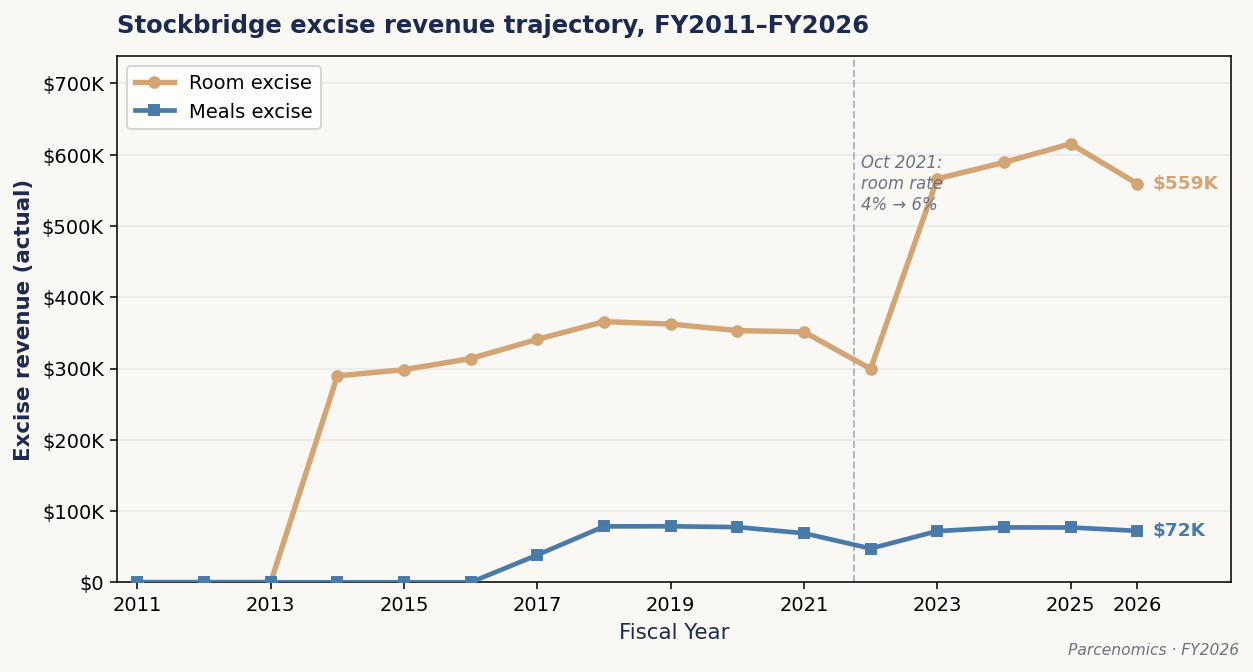
Stockbridge had a local-option rooms tax in place at a 4% rate for several years before the pandemic. Room excise revenue grew gradually from $290,000 in FY2014 to $362,000 in FY2019 — a slow upward trajectory that tracked the modest growth of the lodging industry in the Berkshires.
In 2021, Town Meeting voters approved a Select Board recommendation to increase Stockbridge’s local-option rooms tax rate from 4% to 6% — the maximum allowed under state statute. The rate change took effect October 1, 2021.5 The result is visible in the trajectory: room excise revenue grew from $362,000 in FY2019 to $559,000 in FY2026, a 1.55× increase. Underlying room-night volume contributed only marginally to that growth. The Town’s deliberate policy action produced the bulk of the revenue gain.
The state’s local-receipts dashboard series corroborates the magnitude: Stockbridge’s total local receipts moved from approximately $1.33 million in FY2021 to approximately $3.13 million in FY2026, the same back-half climb the rooms-and-meals lever, growing excise on a recovering tourism economy, and other local-receipt growth together produce. The excise lever documented here is the deliberate, identifiable component of that broader local-receipts climb.
The arithmetic on the rooms lever specifically: at the prior 4% rate, FY2026’s gross lodging activity would have produced approximately $373,000 — barely 3% above the pre-pandemic baseline. The 50% increase in the local-option rate produced the remaining $186,000 of the revenue gain. Roughly fifty of the fifty-five percentage points of room excise growth from FY2019 to FY2026 are attributable to the rate change. The lever did the work.
| Scenario | Local-option rate | Room excise revenue |
|---|---|---|
| FY2019 (actual) | 4% | $362,000 |
| FY2026 actual | 6% | $559,000 |
| FY2026 if rate had stayed at 4% | 4% | $373,000 |
| Revenue gain from rate change | — | $186,000 |
| Revenue gain from volume change | — | $11,000 |
Meals excise has followed a more modest trajectory. Stockbridge’s first meals excise receipts appeared in FY2017 ($38,000), and the line has stabilized at roughly $70,000-$80,000 per year since FY2018, with a COVID-era dip. Total meals excise revenue is small relative to room excise — meals excise has historically run at 15-20% of room excise volume — but it represents another local-option lever the Town has activated.
The aggregate effect: by FY2026, Stockbridge collects approximately $631,000 per year in combined rooms-and-meals excise revenue. Of that, more than half is the product of the 4%-to-6% rate change. The town moved from a passive fiscal posture on rooms tax (the lower available rate, the default option) to an active one (the maximum allowed under statute) right at the inflection point when commercial new growth was collapsing. The timing was not coincidence. The town’s leadership recognized that the commercial revenue lever was failing and acted on the excise lever that was still available.
This is the empirical foundation for the fiscal levers Chapter 5 examines in detail. The levers are not theoretical. The Town has used one — the rooms tax rate change — and the revenue effect is measurable. The methodology that produced the room excise gain is the same methodology that applies to the other levers Chapter 5 takes up: identify a statutory authority the Town has not fully used, vote to use it, measure the result.
What this means for Chapter 4
The three trends documented in this chapter — residential outpacing commercial in AV growth, the post-pandemic commercial new-growth nullity, and the deliberate use of the excise lever — combine to explain the structural picture Chapter 2 described. The current tax base is not anomalous. It is the predictable cumulative result of sixteen years of these trends operating in parallel.
Chapter 4 turns from how the tax base evolved to what those evolved structural features mean for Stockbridge’s fiscal position going forward. The town’s 2024 designation as a Seasonal Community under the state Affordable Homes Act is the formal recognition of a status the data in this chapter and the prior two have documented analytically. Chapter 4 examines what that designation signals and what it permits.
Footnotes
- 16-year class AV trajectory from packet 3a (FY2011-FY2026 reconstruction against the DOR-certified Class Levy Recap series). Residential CAGR of 4.066% computed as (1,361,988,320 / 749,168,700)^(1/15) − 1; rounds to 4.07%. Commercial CAGR of 2.818% computed as (70,284,700 / 46,323,900)^(1/15) − 1; rounds to 2.82%. Industrial CAGR of 3.83% and personal property CAGR of 3.41% surfaced from the same packet for context. ↩
- Massachusetts DOR Municipal Finance Trend Dashboard, assessed-value-by-class series for Stockbridge, FY2016-FY2026. The dashboard’s residential/open-space class is slightly broader than the canonical Chapter 3 residential class (it includes open-space land), which is why the dashboard’s $762.9M FY2016 figure differs modestly from the Class Levy Recap series’ $749.2M FY2011 anchor. Both series describe the same trend. ↩
- New growth figures from packet 3d, capturing the Proposition 2½ new-growth allowance reported annually on the Tax Rate Recapitulation. Pre-pandemic window (FY2013-FY2019): $37,133,100 residential / open space, $4,124,900 C&I, ratio 9.0:1. Post-pandemic window (FY2020-FY2026): $57,433,600 residential / open space, $749,100 C&I, ratio 76.7:1 (rounds to 77:1). Five years at $0 C&I new growth post-pandemic: FY2020, FY2022, FY2023, FY2025, FY2026. ↩
- EQV trajectory from packet 3e, sourced from DOR LA-19 biennial Equalized Valuation publications. Eight biennial cycles in the window (FY2010 through FY2024). Per-cycle in-year assessment-to-sale ratios ranged from 94.78% (FY2014) to 99.72% (FY2010); all comfortably within the DOR’s 90-110% certification band. The implied 114.1% ASR for FY2026 referenced in Chapter 2 Note 8 is computed as FY2026 CAMA against the most recently published EQV (FY2024); the FY2026 EQV is scheduled for late 2026 publication and will substantially close the gap. ↩
- Stockbridge / West Stockbridge joint fire and EMS operation. Sources: Berkshire Eagle, “Stockbridge leaders support landmark plan to share firefighter/EMS services with West Stockbridge,” December 26, 2024 (Clarence Fanto); Berkshire Eagle, “Stockbridge budget to rise 4.7% as town expands fire, EMS services,” April 15, 2026 (Clarence Fanto); The Berkshire Edge, “Stockbridge officials eye more detail on West Stockbridge merger of fire, emergency medical services,” April 2025; Town of Stockbridge Fire/EMS Committee documentation. Capital cost figures from the December 2024 Berkshire Eagle reporting and the Town’s March 2025 working-group presentations. Operational target date July 1, 2027; current Stockbridge EMS service is provided through paid shared-services contracts with the Town of Lee (covering most of Stockbridge) and the Town of Lenox (covering the Stockbridge Bowl area), and through at-no-cost regional coverage by the Southern Berkshire Ambulance Squad in the Furnace District and the southern portion near Housatonic. These arrangements continue through the FY2026 and FY2027 transition years. ↩
- Excise revenue trajectories from packet 3f, sourced from DOR DLS Schedule A annual filings. Stockbridge’s local-option rooms tax rate was increased from 4% to 6% by Town Meeting vote on Select Board recommendation, effective October 1, 2021. The decomposition of the FY2019 to FY2026 room excise growth: $362,402 (FY2019, 4% rate) to $559,265 (FY2026, 6% rate, full year). At the prior 4% rate, FY2026 gross lodging activity would have produced approximately $372,843, a 2.9% increase over the pre-pandemic baseline. The rate increase accounts for the remaining $186,422 of the gain. ↩
- The DOR Municipal Finance Trend Dashboard overlay series for Stockbridge shows abatements granted running between roughly $20,000 and $45,000 in most fiscal years, with a single-year spike of approximately $152,000 in FY2019. This profile treats the FY2019 figure as likely an outlier — most plausibly attributable to one large case — and does not draw any inference about Stockbridge’s abatement posture from a single anomalous year. ↩