Chapter 2 — The Property Picture
Like most Massachusetts municipalities, Stockbridge faces a tax base that wasn’t designed around the fiscal pressures it now has to absorb. School obligations dominate. Commercial growth is limited. The residential tax base does the heavy lifting. This chapter examines Stockbridge’s tax base in detail: what it consists of, who owns the residential portion, what sits outside the tax rolls, and what structural features of the picture determine what the town can do.
A note on what assessed value means before this chapter uses the term throughout. Assessed value is the dollar value the town assigns each property for tax purposes, set annually by the assessors based on recent sale prices of similar properties. State law requires these values to track what each property would actually sell for. In aggregate, Stockbridge’s assessments do — the town’s overall assessed value tracks within the state’s accepted range of actual market value. Whether the assessments are equally accurate property-by-property is a separate question this chapter takes up below.
The total tax base
Stockbridge’s total taxable assessed value for FY2026 is approximately $1.495 billion.1 This is the figure the town reports to the Massachusetts Department of Revenue and the base from which the property tax levy is calculated. When tax-exempt property is added — religious institutions, the Boston Symphony Orchestra’s Tanglewood campus, the Town’s own holdings, state-owned land — the inclusive base reaches approximately $1.682 billion. The $187 million gap is the value of property in Stockbridge that exists on the assessor’s rolls but is exempt from taxation under state law.
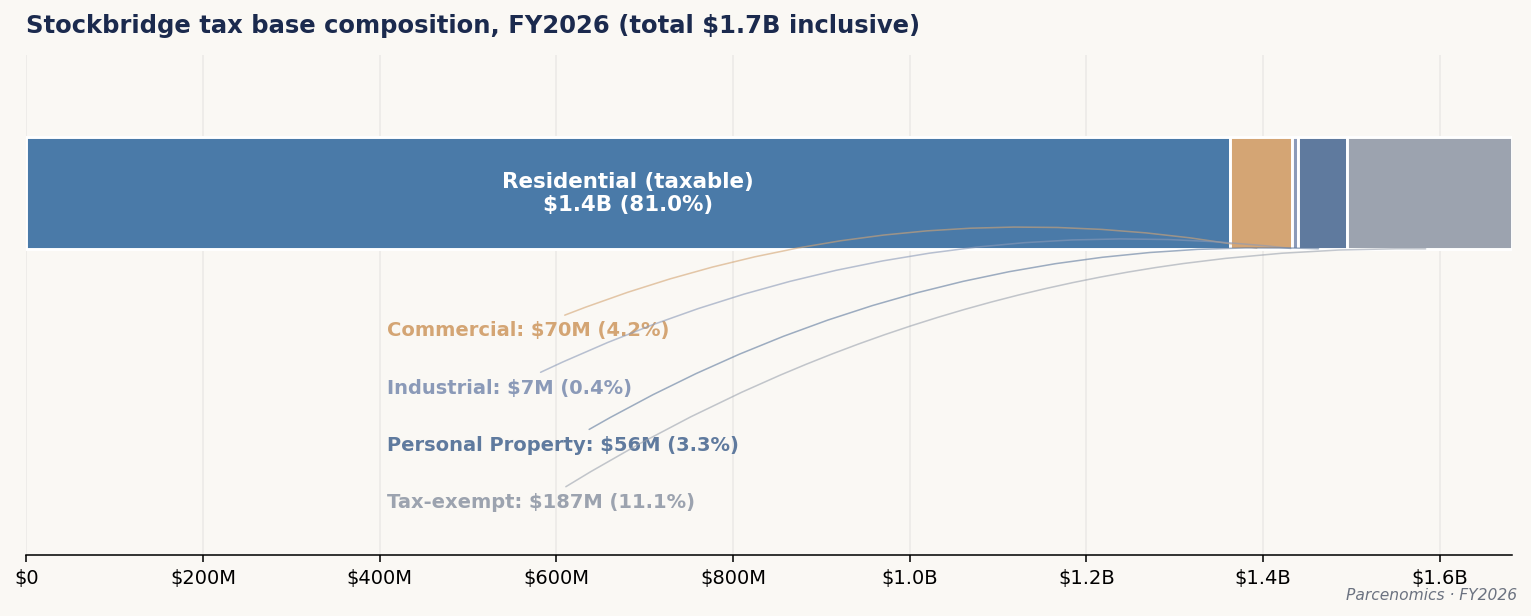
The chart makes the chapter’s most consequential structural feature visible immediately: residential property is 91.1% of the taxable base, and the four non-residential classes combined are less than 9%. Any fiscal lever that depends on the commercial or industrial base — broadening it, taxing it differently, growing it — operates on a footprint that is a small fraction of where the value actually sits. The exempt slice, addressed later in this chapter, is another 11.1% of the inclusive base sitting entirely outside the levy.
A structural question about the figures above
The figures above are accurate at the aggregate level. The Massachusetts Department of Revenue certifies each town’s assessments every five years by comparing total assessed value against the state’s independent estimate of total market value. Stockbridge passes that test.2
Whether the figures are equally accurate property-by-property within the residential class is a separate question that the aggregate test cannot answer. A substantial body of research — peer-reviewed work from the Federal Reserve Bank of Philadelphia, the University of Chicago, and the Lincoln Institute of Land Policy — documents that mass appraisal systems systematically over-assess modest homes relative to high-value ones, even when the system’s aggregate figure is correct.3 This is called within-class regressivity, and it operates not from bias but from a mathematical feature of how the assessment algorithm works.
The mechanism: the town’s assessment algorithm calibrates from recent arm’s-length sales. For a $400,000 home, there are dozens of comparable recent sales in Stockbridge and similar Berkshire towns. The algorithm calibrates tightly against this rich comparison set. For a $4 million estate with thirty acres, there might be two or three remotely comparable sales in the entire county over five years, and most of those sales pre-date the recent appreciation cycle. The algorithm has to extrapolate from dissimilar properties, and extrapolation almost always produces a conservative estimate.
The result is asymmetric. The modest home gets assessed at roughly what it would sell for. The high-value estate gets assessed below what it would sell for. Both pay tax at the same rate per $1,000 of assessed value. But the modest homeowner pays property tax on close to 100% of their home’s actual market value, while the estate owner pays property tax on 60% to 70% of theirs.
A concrete example. Take two properties in Stockbridge: a modest $400,000 home and a $4 million estate. Both pay tax at the same rate of $6.79 per $1,000 of assessed value. The modest home pays roughly $2,716 in property tax. If the estate is assessed conservatively at $2.8 million — which the research literature suggests is typical for high-end properties in resort markets — it pays roughly $19,012.
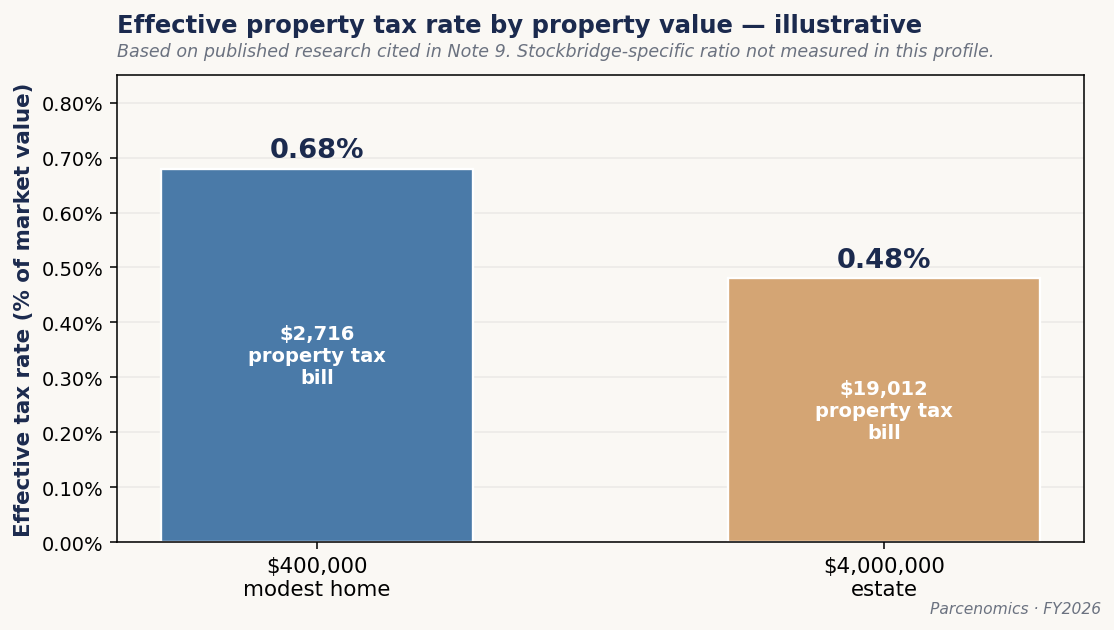
The estate pays seven times more in absolute dollars, in line with its assessed value. But against the estate’s actual $4 million market value, the effective tax rate is 0.48%. The modest home pays 0.68% against its market value. The owner of the modest home is paying property tax at a higher effective rate than the owner of the estate, even though both are taxed at the same nominal rate.4
This is not an allegation against Stockbridge’s assessors. It is a known structural feature of mass appraisal in resort markets with extreme price variance and thin high-end transaction volume. Every town in Berkshire County with a trophy-property tail faces the same mathematical condition. Whether it operates at meaningful scale in Stockbridge specifically would require a price-stratified ratio study using local sales records — sorting residential transactions by sale price, dividing into bands, and comparing assessment-to-sale ratios across the bands. The data needed for that analysis exists in MLS records and assessor files; the work has not been performed for Stockbridge.5
The point for the chapter that follows is this: every figure presented below sits within this caveat. The assessed-value-based ownership shares are accurate measurements of who owns what *by assessed value*. The underlying *market-value* concentration of property wealth in Stockbridge is almost certainly more extreme than the assessed-value figures suggest. This bears directly on every fiscal lever the town has and is the first of two distinct fairness questions this profile examines. The second — residency-status fairness, addressed by the residential tax exemption under c.59 §5C — is taken up in Chapter 5.
The transactional anchor
Mass-appraisal systems rely on observable sale prices to validate their assessment estimates. The Computer-Assisted Mass Appraisal model used by the Stockbridge assessor produces a current estimated market value for each parcel based on the parcel’s physical characteristics, comparable recent sales, and applicable market-trend adjustments. For parcels that have transacted recently, the model has a ground-truth signal — the actual sale price — against which the estimate can be calibrated. For parcels that have not transacted in many years, no such validation point exists. The model carries forward through biennial state Equalized Valuation cycles, applying market-trend overlays, but the estimate for any individual parcel is anchored to mass-appraisal logic rather than to an observable transaction.
The FY2026 implied assessment-to-sale ratio for Stockbridge — CAMA-aggregate value divided by the Department of Revenue’s most recent Equalized Valuation publication — is 114.1%. The ratio sits modestly above the DOR’s 90%-110% certification band. The aggregate lag is consistent with the biennial measurement cycle: the FY2026 CAMA reflects post-pandemic market appreciation that the FY2024 EQV publication had not yet fully captured. The FY2026 EQV, scheduled for publication in late 2026, will substantially close the gap.
The aggregate measurement is consistent with a structural pattern: long-held parcels carry the deepest lag because they have not produced transactional validation points within the available history. Chapter 5 Section A1 examines this pattern at the parcel level for non-resident-owned residential parcels specifically, where the cohort of long-held parcels constitutes the bulk of assessed value.
Who owns the residential property
Three categories of ownership account for substantially all of Stockbridge’s $1.354 billion in residential assessed value.6
Primary-resident-owned property — homes where the owner is registered to vote at the home’s address — accounts for $528,966,400 across 698 parcels.
Non-resident-owned property — homes where the owner’s primary residence is somewhere else, identified through a combination of mailing-address evidence, voter-file absence, and class-aware classification rules — accounts for $808,300,020 across 898 parcels.
Entity-owned, unresolved — residential property held by LLCs or trusts whose underlying natural-person ownership could not be traced from public records — accounts for $17,076,100 across 100 parcels.
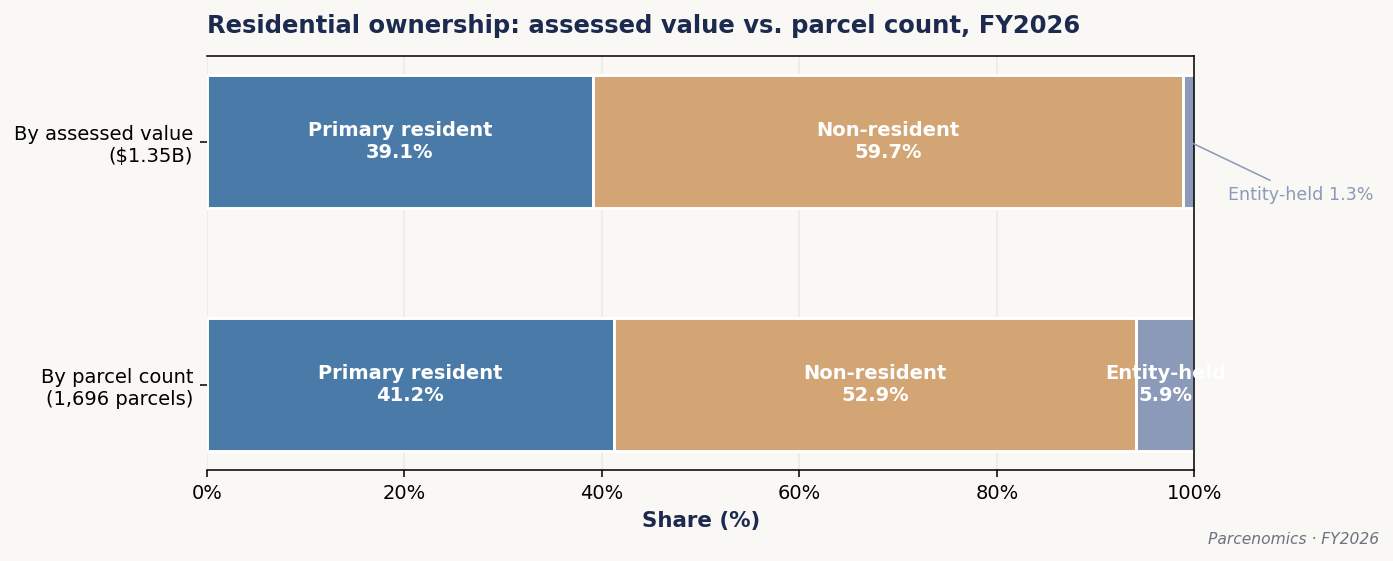
The chart shows the structural asymmetry directly. Non-resident owners hold 59.7% of residential value while owning only 52.9% of residential parcels. Primary residents hold 39.1% of value while owning 41.2% of parcels. Non-resident-owned homes tend to be more valuable than primary-resident-owned homes — substantially so. The average non-resident-owned residential property in Stockbridge has an assessed value of approximately $900,000. The average primary-resident-owned residential property is approximately $758,000.
About six out of every ten dollars of residential property value in Stockbridge is owned by people who do not live here year-round.
The structural fairness caveat raised above applies here with particular force. If high-value properties are systematically under-assessed relative to modest homes, the assessed-value-based ownership shares almost certainly understate the actual wealth concentration. The 59.7% non-resident share by assessed value almost certainly understates the actual market-value concentration. Non-resident-owned property in Stockbridge skews heavily toward the high-value tail of the residential market, which is the part of the market the assessment algorithm is most likely to under-state. The 39.1% primary-resident share is, by the same logic, an upper bound on the true market-value share. The directional finding holds. The precise magnitude of the gap between assessed-value share and market-value share is not measurable from the public records this profile draws on.
Where the non-resident owners are from
Locals know that non-resident owners are mostly not from here. The question that matters analytically is *how concentrated* the non-resident origin is, because origin concentration affects how aligned the non-resident population is around any particular set of preferences, expectations, or political pressures.
Owners with primary residences in New York hold approximately 17.7% of all Stockbridge residential property by assessed value — the single largest non-resident origin concentration by a wide margin.
| State | Parcels | Assessed Value | % of all residential AV |
|---|---|---|---|
| New York | 245 | $239,215,400 | 17.7% |
| Florida | 59 | $63,834,800 | 4.7% |
| New Jersey | 54 | $39,061,900 | 2.9% |
| Connecticut | 28 | $21,117,000 | 1.6% |
| California | 27 | $25,501,900 | 1.9% |
An independent data source confirms the pattern. A 2022 survey conducted by the Berkshire Regional Planning Commission asked Berkshire County second-home owners where their primary residences were. Forty percent of respondents reported the greater New York City area; another 18% reported the Boston area.7 Stockbridge was one of the top five towns by survey participation, so the county-level findings are partly Stockbridge findings.
The same survey asked respondents about household income. Nearly half — 44.65% — reported income of $250,000 or more, the survey’s highest category, with no upper bound.8 Stockbridge sales data from FY2020-FY2026, analyzed in Chapter 1, implies that arriving year-round Stockbridge households earned approximately $268,000. The 2022 survey and the 2026 sales analysis approach the wealth concentration from different angles. They agree on its scale.
What’s outside the tax base
Stockbridge has $187 million in tax-exempt real property — buildings and land that exist on the assessor’s rolls but are exempt from property tax under state law because of how they are used. That is 11.1% of the town’s inclusive assessed value. Tax-exempt property sits within the town’s geography, draws on town services like roads and emergency response, but does not contribute to the property tax levy.
| Institution | Parcels | Assessed Value | Category |
|---|---|---|---|
| Boston Symphony Orchestra / Tanglewood | 9 | $31,108,500 | Cultural / charitable |
| Town of Stockbridge | 43 | $23,807,400 | Governmental |
| Kripalu Center | 3 | $22,558,600 | Educational / religious |
| Austen Riggs Center | 9 | $17,400,900 | Medical / charitable |
| Massachusetts Turnpike Authority | 2 | $11,507,500 | Governmental (state) |
These five institutions account for $106 million — 57% of all exempt assessed value in Stockbridge. If their property were taxable at the FY2026 rate of $6.79 per $1,000, they would together produce approximately $720,000 in annual tax revenue.
A structural observation worth surfacing: the institutions on this list are not incidental to Stockbridge. They are part of what makes Stockbridge what it is. The Boston Symphony’s Tanglewood campus and Kripalu are among the cultural amenities the BRPC survey identified as the leading reason second-home owners chose Stockbridge in the first place (60% of survey respondents called cultural amenities “extremely important” in their purchase decision — the single most-cited factor9). Austen Riggs is a nationally significant psychiatric treatment center. The cultural and institutional anchors that drive Stockbridge’s appeal sit outside the tax base, which means the tax base bears the cost of municipal services to support an economy whose principal value-generators do not pay into the levy.
This is a structural pattern Stockbridge shares with other Berkshire towns. Lenox has Tanglewood-adjacent institutions and Shakespeare & Company. Williamstown has Williams College and the Clark Art Institute. Great Barrington has Bard College’s former Simon’s Rock campus (now closed and pending redevelopment). Each town’s cultural identity rests on tax-exempt institutions that contribute to its character without contributing to its levy.
The edge: Chapter 61, 61A, and 61B
Massachusetts law allows certain working landscapes to be assessed below their full market value if they remain in productive use. Land enrolled under Chapter 61 (working forest), Chapter 61A (agricultural use), or Chapter 61B (open recreational use) pays property tax on a use-value assessment that is substantially below what the same land would be assessed at as residential development.
Stockbridge currently has 27 parcels enrolled under one of the three preferential classifications: 13 Chapter 61 forest parcels, 8 Chapter 61A agricultural parcels, and 6 Chapter 61B recreational parcels. Combined preferential assessed value: $1,752,600. The footprint is small.
The trajectory matters more than the current footprint.
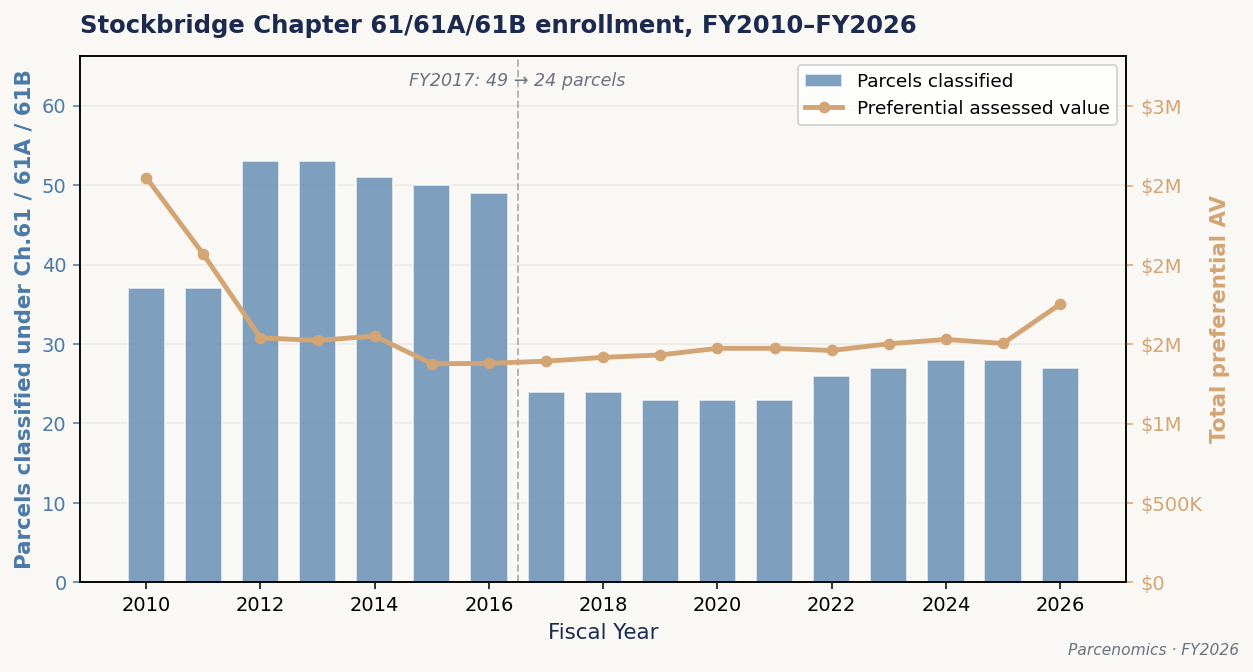
In FY2017, the number of Stockbridge parcels enrolled in any Chapter 61 classification dropped from 49 to 24 — a roughly 50% reduction in a single year. The total preferential assessed value, however, stayed almost exactly flat ($1.379 million in FY2016, $1.393 million in FY2017). The 25 parcels that fell out of classification held only de minimis preferential value. The reclassification event was primarily administrative, not fiscal.
The Chapter 61 family is small in Stockbridge but worth understanding for one reason: it contains the existing legal precedent in Massachusetts for *rollback taxes on use change*. When a Chapter 61-classified parcel is sold or converted to non-qualifying use, the seller pays the municipality the difference between what was paid under the preferential assessment and what would have been owed at full assessed value — for the prior five years under Chapters 61 and 61A, the prior four years under Chapter 61B, plus statutory interest. The seller has the liquidity from the sale to make the payment. The municipality receives revenue it was due. No assessor needs to admit error. The market transaction itself triggers the correction.
The principle this establishes — that a property owner who realized the full market value of their property at sale should repay the tax benefit they received from preferential assessment during their ownership — is a precedent worth keeping in mind. Chapter 5 discusses how this same principle might be extended to address the within-class regressivity concern raised earlier in this chapter, through a sale-triggered assessment true-up that operates on the same logic as the existing Chapter 61 rollback mechanism. The legal and philosophical foundation already exists in Massachusetts law. The question is whether it should be extended.
Personal property tax
Personal property tax is the part of the tax base that is not real estate. In Stockbridge it accounts for $56.2 million in assessed value — 3.8% of the taxable base. Personal property tax is paid by two distinct categories of taxpayer.
| Category | Assessed Value | % of PPT base |
|---|---|---|
| Utility infrastructure | $44,541,897 | 79.3% |
| Second-home and business furnishings | $11,620,784 | 20.7% |
| Manufacturing | $0 | 0.0% |
| Total | $56,162,681 | 100.0% |
Top utility-classified taxpayers, FY2026:
| Owner | Assessed Value |
|---|---|
| Tennessee Gas Pipeline | $16,632,700 |
| Massachusetts Electric | $15,711,696 |
| Berkshire Gas Company | $3,619,867 |
| Level 3 Communications | $3,377,000 |
| Verizon New England | $1,803,400 |
The utility infrastructure category — gas pipelines, electric distribution equipment, telephone wires, and similar utility property whose value is set centrally by the state Department of Revenue rather than by local assessors — accounts for 79.3% of Stockbridge’s personal property tax base. Three companies alone — Tennessee Gas Pipeline, Massachusetts Electric, and Berkshire Gas — hold $35.9 million in assessed value, 64% of all personal property and 81% of utility-classified personal property in Stockbridge.
The second category covers self-reported personal property: the appliances, furniture, and equipment of seasonal homes and small businesses. Compliance among self-reporting taxpayers is uneven across Massachusetts. Whether Stockbridge’s actual personal property tax revenue from this category matches what the statute would produce under full compliance is one of the four compliance streams Chapter 5 examines as potential revenue recovery for the town.
What this means for Chapter 3
The picture this chapter presents is essentially static. It tells the reader what Stockbridge’s tax base looks like in FY2026 — what it consists of, who owns the residential portion, what sits outside the tax rolls, what structural questions surround the assessed-value figures themselves.
Chapter 3 traces how the tax base got here. The 16-year fiscal record shows that the residential dominance, the value concentration, and the limited commercial footprint documented in this chapter are not recent features. They are the cumulative product of policy choices and market forces operating over a decade and a half. Understanding the trajectory makes the structural features of the current picture predictable rather than surprising.
Footnotes
- All tax base figures from packet 2a, FY2026 Tax Rate Recapitulation reconciliation. The total taxable assessed value of $1,495,161,601 is the Massachusetts Department of Revenue Recap-certified figure. Residential class total of $1,361,988,320 is the Recap Class 1 line. A $7.6 million reconciliation difference exists between the Recap residential total ($1,361,988,320 / 1,697 parcels) and the parcels-table residential figure ($1,354,342,520 / 1,696 parcels) used as the denominator for ownership-share analysis later in this chapter. The difference is attributable to Multi-use Residential parcels (classes 012-043) and Chapter 61/61A/61B land treatment edges. Both denominators are correct for their respective analytical purposes. ↩
- Stockbridge’s FY2026 implied assessment-to-sale ratio (CAMA total ÷ DOR Equalized Valuation) is 114.1%. The Department of Revenue’s certification band requires the median ASR to fall between 90% and 110%. Stockbridge sits modestly above the upper bound, likely because local assessments have kept pace with post-pandemic market appreciation that the biennial state Equalized Valuation has not yet fully captured. The DOR certified Stockbridge’s FY2026 Recap on October 27, 2025. ↩
- Key references: Amornsiripanitch, N. (2022), “Why Are Residential Property Tax Rates Regressive?” Federal Reserve Bank of Philadelphia Working Paper 22-02. Avenancio-León, C.F. & Howard, T. (2022), “The Assessment Gap: Racial Inequalities in Property Taxation,” Quarterly Journal of Economics 137(3). Berry, C. (2021), University of Chicago Center for Municipal Finance. Harvard Journal on Legislation, “Your House Is Worth More Than They Think: The Strange Case of Property Tax Assessment Regressivity,” February 2025. ↩
- The worked example uses illustrative numbers, not specific Stockbridge transactions. The 60-70% conservative-assessment range for high-end properties is consistent with published research on resort-market mass appraisal cited in note 9. The actual ratio for Stockbridge specifically is not measurable from the public records this profile draws on. ↩
- A price-stratified ratio study — sorting residential transactions by sale price, dividing into price bands, and comparing median assessment-to-sale ratios across the bands — is the standard methodology for measuring within-class regressivity at the municipal level. Such a study has not been performed for Stockbridge. The data inputs needed (MLS arm’s-length sales records matched against assessed values as of the prior January 1) are available; the analysis is not within the scope of this profile. ↩
- Ownership-share figures from FY2026 ownership triangulation using the residency tier classifier with manual override layer. Denominator for the percentage shares is the parcel-aggregated residential figure of $1,354,342,520 across 1,696 parcels. See note 7 for the relationship between this figure and the DOR Recap Class 1 total. Methodology for the residency tier classifier is documented in the Technical Appendix. ↩
- Source: Berkshire Regional Planning Commission, Survey of Second Homeowners — Results (August 2022). The survey was sent to all second-home owners in Berkshire County, with 731 respondents from across the county’s 30 towns (Berkshire County contains 32 municipalities — 2 cities and 30 towns). Stockbridge was one of the top five participating towns with 61 respondents (8.3% of the sample). The full report is available at berkshireplanning.org. ↩
- Source: Berkshire Regional Planning Commission, Survey of Second Homeowners — Results (August 2022). The survey was sent to all second-home owners in Berkshire County, with 731 respondents from across the county’s 30 towns (Berkshire County contains 32 municipalities — 2 cities and 30 towns). Stockbridge was one of the top five participating towns with 61 respondents (8.3% of the sample). The full report is available at berkshireplanning.org. ↩
- Source: Berkshire Regional Planning Commission, Survey of Second Homeowners — Results (August 2022). The survey was sent to all second-home owners in Berkshire County, with 731 respondents from across the county’s 30 towns (Berkshire County contains 32 municipalities — 2 cities and 30 towns). Stockbridge was one of the top five participating towns with 61 respondents (8.3% of the sample). The full report is available at berkshireplanning.org. ↩