Chapter 1 · The Structural Gap
The gap the levers act against (frame — not a lever)
Before the levers, the shape of the problem they address. This is the growth-driven structural gap — deliberately not a current-state recap. Reserves, the cannabis settlement, and the levy-squeeze are real, but none of them is a lever, so none enters here. The baseline ties to the certified FY26 recap.
Great Barrington’s budget balances today, but only barely — it has about $507,000 of room left under its Proposition 2½ tax cap in FY26, and no more. Project spending forward and that thin cushion turns into a shortfall. If the Town’s total appropriations grow about 6% a year, the budget climbs from $45.5M in FY26 to $57.4M by FY30 — but the property tax, held down by Proposition 2½, can rise only from $31.1M to $34.3M over those same years. What the Town is committed to spend pulls away from what it is allowed to raise, and the gap between them opens to roughly $8.2M by FY30 (ranging from $6.1M to $10.4M depending on whether total appropriations grow at 5%, 6%, or 7% a year).
Why 6%? It is a labeled forward assumption applied to the Town’s total appropriations — not the school budget alone — and it is anchored in the record. Great Barrington’s total appropriations grew about 5.4% a year over the last decade (FY17–FY26). A 6% central case sits modestly above that pace because the largest and fastest-moving component, the regional school assessment, is projected to accelerate: state education aid to the district is flat to declining even as the district’s budget keeps rising, so the amount the member towns must cover — their assessments — grows faster than the budget itself (a leverage effect), and Great Barrington’s rising share of district enrollment pulls its slice up further still. The 5% and 7% cases are the honest sensitivity band around that central estimate.
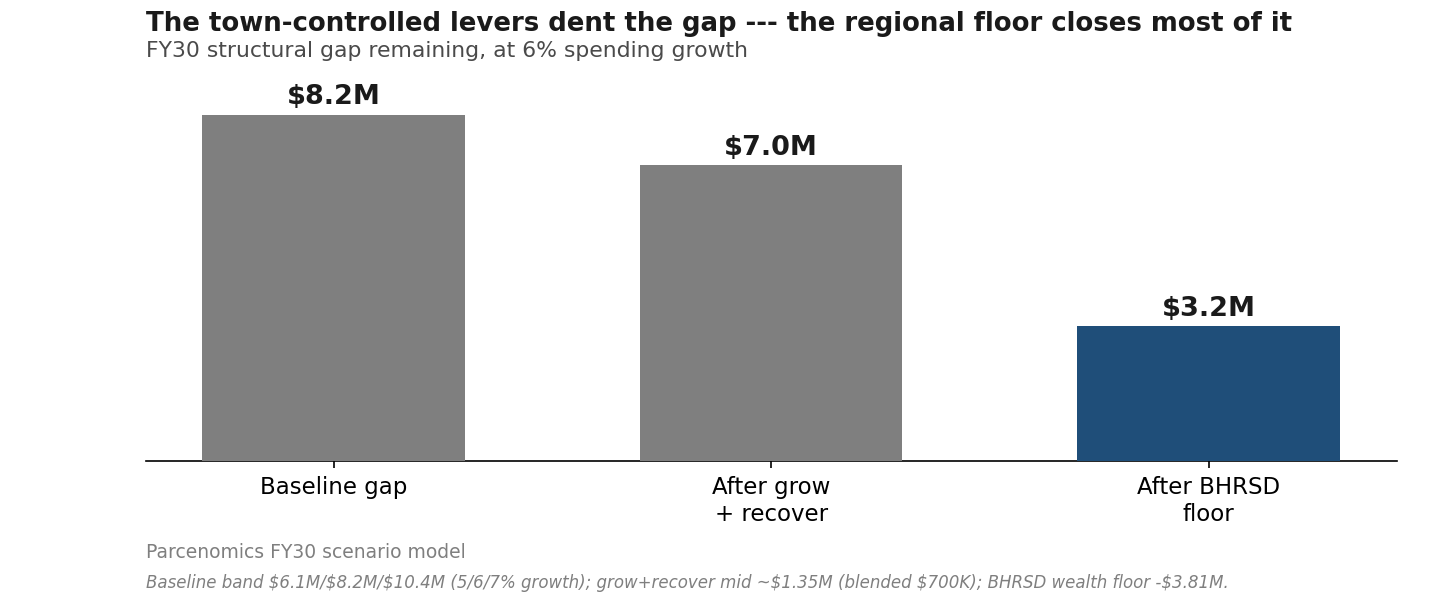
The gap is the starting hole; the levers then fill it. The waterfall below subtracts what each family can do — the town-controlled revenue levers (grow + recover), then the regional apportionment correction (the anchor). It does not subtract the revenue-neutral shift levers (§5C, split rate, regressivity, senior exemptions): those change who pays, not how much is raised, so they never close a gap.
| FY30 (DERIVED) | 5% growth | 6% growth | 7% growth |
|---|---|---|---|
| Baseline gap | $6.1M | $8.2M | $10.4M |
| − Grow + recover revenue (town-controlled, ~$1.35M mid) | −$1.2M | −$1.2M | −$1.2M |
| − BHRSD correction (compromise: wealth floor on enrollment) | −$3.8M | −$3.8M | −$3.8M |
| = Residual gap | ~$1.1M | ~$3.2M | ~$5.4M |
Grow + recover spans ~$0.9–2.2M (mid ~$1.35M). The BHRSD correction spans $3.81M (the wealth-floor compromise) to $9.06M (full EQV) to $10.5M (dissolution); the compromise floor is shown. At full EQV the correction closes the entire FY30 gap on its own in every growth scenario.
Two facts set up the whole menu:
The school assessment is the dominant driver. At 6% growth, total appropriations rise $11.9M from FY26 to FY30; the BHRSD assessment alone rises $6.2M — over half of all spending growth — on a verified 6.3%/yr step against a levy capped at 2.5%. The school’s annual dollar increment outruns the entire levy’s.
The gap is closeable — but mostly through the lever Great Barrington cannot pull alone. The town-controlled revenue levers close only about 15% of the gap (~$1.2M/yr — real money, but not enough). The one lever large enough to close the rest is the BHRSD apportionment correction in the waterfall above, and it requires all three towns plus the Commissioner. That is the menu in one line: the gap is regional, so the decisive lever is the regional one; the town-controlled levers are worth pulling and buy time, but the structural fix is at the regional table.