Chapter 4 · What It Means for the Median Home
The full menu, in dollars
The town-level dollars, and what each lever means for the median owner-occupied home ($453,200), in today’s dollars (↓ = the median home’s bill falls):
| # | Lever | Family | Town $, low | Town $, high | Median savings (low–high) |
|---|---|---|---|---|---|
| 1 | New growth (~$700K/home blended; see §1) | Grow | $232K (25 homes) | $927K (100 homes) | ↓ $45–$180 |
| 2 | Simon’s Rock | Grow | $583K | $781K | ↓ $115–$155 |
| 3 | PP recovery + under-declaration | Recover | $73K | $446K | ↓ $15–$90 |
| 4 | Motor-vehicle excise | Recover | ~$25K | ~$65K | ↓ $5–$13 |
| 5 | Boat excise | Recover | ~$5K | ~$15K | ↓ $1–$3 |
| New + recovered revenue | ~$0.9M | ~$2.2M | ↓ $190–$440 | ||
| 6 | §5C residential exemption (20% / 35% / 50%) | Shift | — | — | ↓ $804–$2,716 (20%–50%) |
| 7 | Within-class regressivity | Shift | — | — | ≈$0 |
| 8 | Split rate | Shift | — | — | limited |
| 9 | Senior / legacy exemptions | Shift | — | — | n/a (targeted) |
| Burden shifted (revenue-neutral) | ~$1.6M | ~$4.7M | ↓ $804–$2,716 (20%–50%) | ||
| 10 | BHRSD apportionment (today’s $) | Anchor | $2.3M | $6.6M | ↓ $450–$1,290 |
| Regional expense relief | $2.3M | $6.6M | ↓ $450–$1,290 |
- New + recovered revenue: ~$0.9M–$2.2M/yr at maturity — the money the Town raises on its own — which lowers the rate enough to save the median home roughly $190–$440 a year. At the mid case (~$1.35M) it closes about 16% of the FY30 structural gap. (Excise lines are order-of-magnitude estimates pending the GB registry run.)
- Burden shifted: ~$1.6–4.7M moved under §5C, depending on the level Great Barrington adopts (20% / 35% / 50%) — revenue-neutral (who pays, never a gap-closer). For the median owner-occupied home it is the single biggest lever: saves $804 at 20%, $1,629 at 35%, $2,716 at 50%, carried by non-resident and high-value property.
- Regional expense relief (BHRSD): $2.3M–$6.6M in today’s dollars (wealth-floor compromise → full EQV), worth $450 to $1,290 a year to the median home — and growing to $3.8M–$9.1M by FY30 as the budget climbs. It is the dominant lever, the one the Town cannot pull alone, and at full EQV it is on the scale of the entire structural gap. (Dissolution is a larger but separate extreme — about $10.5M at FY30 — weighed on control, not dollars, in §10.)
The median-home figures are not additive across the three families at the town level — revenue, a within-class shift, and expense relief are different kinds of money. But for that one household they move the bill the same direction: the §5C cut (a shift funded by non-owner-occupied property) plus the rate reductions from the revenue and apportionment levers stack toward a materially lower bill — on the order of $2,200–$4,300 a year for the median owner-occupant pulling the full menu.
The local revenue levers are worth pulling and do not close the gap; the gap is driven by the regional school assessment, addressable only at the BHRSD table. That is the menu in one line.
What it means for the median home
The tables above are town-level dollars. Here is the same story on one household — the median Great Barrington owner-occupied home, assessed at $453,200, paying about $6,000 today. The levers reach that bill two different ways, and they should not be blurred: one shift lever cuts the bill now; the grow / recover / regional levers don’t cut today’s bill but hold off the increase the budget gap would otherwise force. Both matter to the same homeowner.
The direct cut — the residential exemption (a choice the Selectboard can make now).
| Median owner-occupied bill | Annual tax | Saves |
|---|---|---|
| Today (uniform $13.24 rate) | $6,000 | — |
| Adopt §5C at 20% | $5,197 | ↓ $804 |
| Adopt §5C at 35% | $4,371 | ↓ $1,629 |
| Adopt §5C at 50% (Seasonal Communities) | $3,284 | ↓ $2,716 |
The cut is real and immediate, and it is carried by non-resident and high-value property, not by cuts to services. The other shift levers — a modest split rate, a regressivity correction — would add only a little more for the median home (a guesstimate: another $50–$150), because Great Barrington’s commercial base is thin and its assessment tilt is mild.
The avoided increase — what the gap levers buy (FY30, illustrative). Left alone, the structural gap forces a choice between service cuts and an override; an override large enough to close the FY30 gap would add roughly $1,600 to the median bill. The grow/recover levers and — decisively — the BHRSD correction fill that gap instead, so the median household avoids that increase.
Putting it together (illustrative):
| FY30 path for the median home (all-in property tax) | ~Annual bill |
|---|---|
| Do nothing — gap closed by an override | ~$8,200 |
| Pull grow/recover + win the BHRSD correction (gap filled, no override) | ~$6,600 |
| …and adopt §5C at 35% | ~$5,000 |
| …and adopt §5C at 50% | ~$3,900 |
All-in here is the actual property-tax bill — within-cap operating plus the outside-the-cap school-building bond (about $600/yr, first full year around FY2030–31). It is not the full municipal bill: water and sewer are billed separately and were provided to Parcenomics only in hardcopy, so they are not folded in here — a resident’s true all-in municipal cost runs somewhat higher (see the Technical Appendix). Today’s ~$6,000 carries no bond, because the bond is not levied yet — it arrives by FY30, which is why the FY30 bars step up.
The spread is the headline for the median resident: the difference between doing nothing and pulling the full menu is on the order of $3,000–$4,000 a year by FY30 — roughly half of today’s bill. The visible cut comes from the residential exemption; the protection from a far larger increase comes from the levers that close the gap, above all the regional apportionment correction.
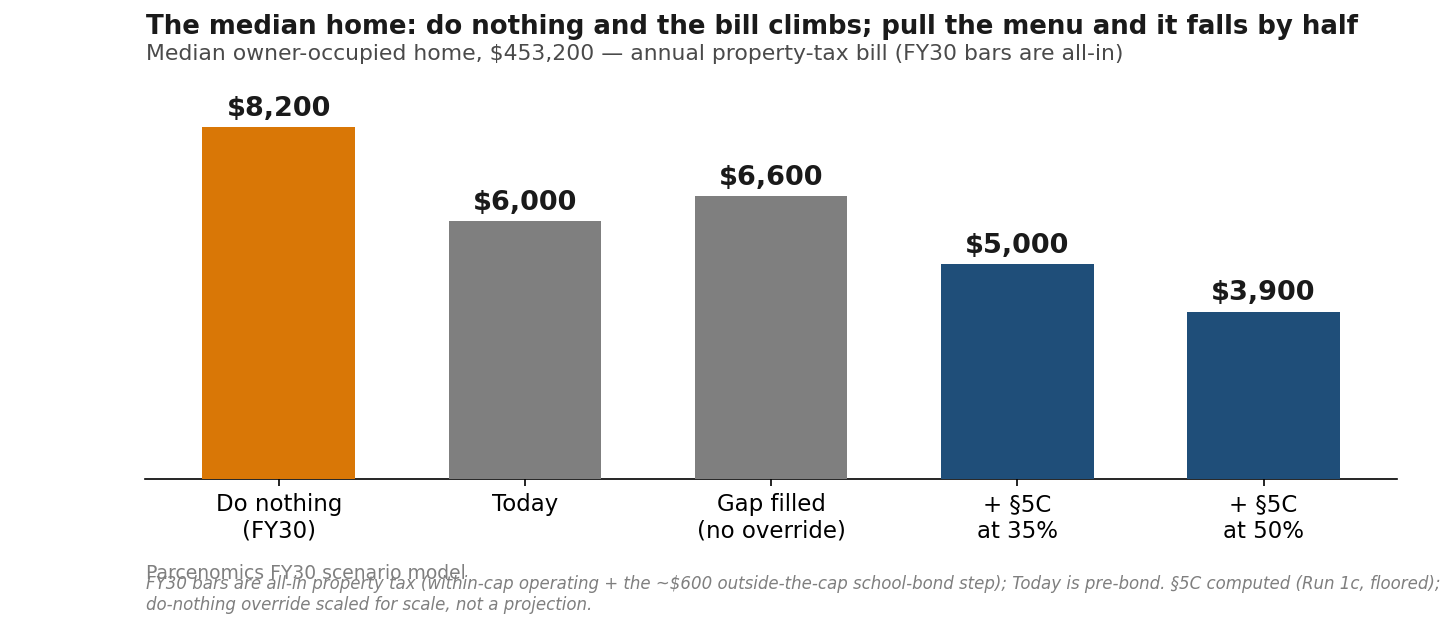
All FY30 figures are illustrative. The §5C figures are computed (Run 1c, floored); the do-nothing override and the “other shifts” line are guesstimates for scale, not projections; the BHRSD protection depends on a regional decision the Town does not control alone; and grow/recover capacity is potential, not bankable until built and assessed.
The one increase the levers can’t touch — the new school building bond
Everything above happens inside the Proposition 2½ cap. One large item sits outside it, and no lever, cut, or apportionment change in this report can reach it: the debt service on the new high-school building. The district-wide bond for the Monument Mountain project was approved by the three towns’ voters in November 2025 as a Proposition 2½ debt exclusion — a charge levied on top of the capped levy, spread across every taxable property in town, that the cap does not limit and that cuts cannot reduce (it is a contractual debt payment).
It arrives as a step, not a gradual climb. During construction the Town pays only modest interim interest; then, in the first full year after the permanent bonds are sold — estimated around FY2030–31, tied to when the bonds are issued rather than to the school’s fall-2029 opening — the bill steps up to full debt service. (The exact year and rate are not yet known: the bonds have not been sold, so everything here is approximate.)
What that step does to a homeowner’s bill, in round terms: Great Barrington’s share of the debt service is on the order of $2.7–3.3 million a year (about $2.9M mid-range), after netting the state building-authority grant — so the figure is materially smaller than the gross project cost implies. Spread across the Town’s roughly $2.3 billion of total taxable value, that adds about $1.2–1.4 per $1,000 to the rate — roughly $600 a year on the median owner-occupied home ($453,200), taking its bill from about $6,000 to about $6,600. That is on the order of a 10% one-year jump — outside the cap, on a bill many households already can’t stretch to cover — landing on top of whatever the operating side of the bill is doing.
Two things keep this honest and un-blended:
- It is separate from the operating gap this report addresses. The gap, the levers, the residual, and the cuts discussion are all within the cap — billed operating dollars that levers and reapportionment can move. The building bond is outside the cap — a voter-approved debt exclusion that those tools do not touch. The two should never be added into one growth rate; they are different money.
- The operating side of the bill grows slowly by comparison. Within the cap, the levy rises only about 2.5% a year under Proposition 2½ plus new growth (on the order of ~4% in practice) — not the 6% figure used for the appropriations gap, which measures unfunded commitments, not billed dollars. So the bond step is genuinely the single biggest one-year increase a Great Barrington homeowner’s bill faces in this whole picture. (GB share, rate, and timing computed from the district bond figures net of the MSBA grant; approximate pending bond issuance.)
One more capital asymmetry, on the same bond. How the bond’s cost is split among the three towns is fixed for the life of the debt. Under the 2017 agreement, each town’s capital share is frozen at its share of regional property wealth (equalized valuation) as of the November 2025 authorization vote — Great Barrington 52.8%, Stockbridge 31.4%, West Stockbridge 15.7%. That lock is legally correct and follows the agreement; the wrinkle is one of timing, not intent. Stockbridge’s large development pipeline — the two permitted projects, estimated at $214–299 million of new assessed value (an estimate from the permits) — lands after the shares were locked. Had that value already been on the rolls at the vote, Stockbridge’s capacity-based capital share would sit closer to 35–37% (estimated) than 31.4%; the difference — on the order of $4–5 million of bond debt service over the life of the borrowing (estimated) — effectively falls to Great Barrington and West Stockbridge instead. Nothing improper follows from this; it is simply that the town about to gain the most new wealth pays its bond share on its pre-windfall valuation. (Frozen shares verified to the 2017 agreement; the pipeline, capacity-share, and shift figures are estimates from the permitted projects.)
What the leftover gap would mean — and why cuts can’t reach what drives it
The levers in this menu close part of the gap, not all of it. It is worth stating plainly what is left after the Town does everything it can — and why the size of that leftover is set far more by a decision the Town cannot make alone than by how hard it works its own levers.
The leftover, in one table
After the Town’s own revenue levers and whatever regional apportionment relief is achieved, the gap that remains has to be closed by an operating override, by service cuts, or by some mix. How big that leftover is depends on two things — one much larger than the other:
- What the district does (the big swing). If the apportionment stays exactly as it is, the Town gets no relief on its largest cost. The wealth-floor compromise returns about $3.8M to Great Barrington by FY30; a full ability-to-pay basis returns about $9.1M — more than the entire gap.
- What the Town raises on its own (the smaller swing). Pulling every revenue lever in this menu adds, at the high end, about $2.2M a year.
Put those together and the FY30 leftover looks like this (at 6% spending growth; the gap is ~$8.2M):
| Left to close by cuts-or-override | Town pulls no revenue levers | Town pulls every lever (~$2.2M) |
|---|---|---|
| District: no change | ~$8.2M | ~$6.0M |
| District: wealth floor (compromise) | ~$4.4M | ~$2.2M |
| District: full ability-to-pay | gap closed | gap closed |
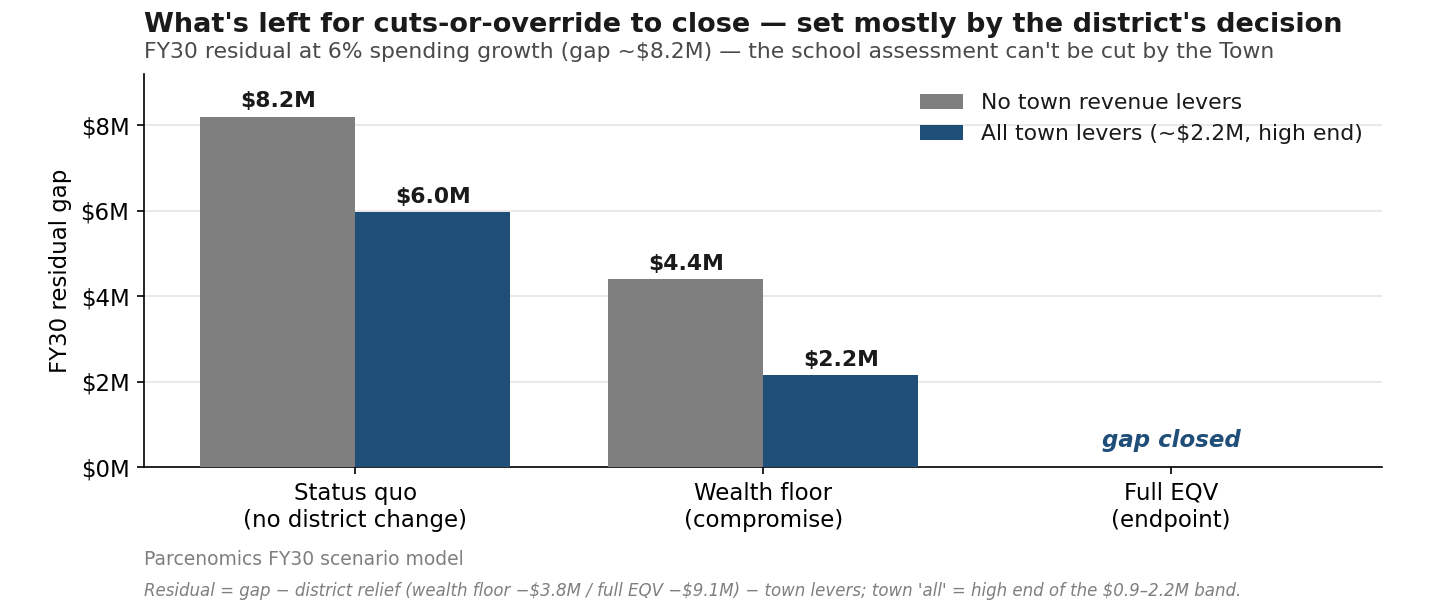
The pattern is the point. Moving the district from no-change to the wealth floor takes the leftover down by about $3.8M; pulling every Town revenue lever takes it down by about $2.2M. The Town’s own effort matters — but the district’s decision matters more. (At 5% or 7% spending growth each figure shifts by roughly $2M, but the pattern holds.)
Why the cuts fall where they do
Here is the part that surprises people: the single biggest thing the Town spends money on is the one thing it cannot cut. Great Barrington’s largest expense is its assessment to the regional school district — about $21M of roughly $38M in general-fund spending (FY2025 actuals; the FY26 budget carries ~$22.4M). That assessment is a mandatory charge: the Town must pay it in full, and it is set by a three-town formula the Town cannot change on its own. So not one dollar of any budget cut can come from it. (Every residual figure here is a within-the-cap number; the separate school-building bond — a debt exclusion levied outside the cap, described in the median-home section above — is likewise beyond the reach of any budget cut.)
Every dollar of cuts therefore has to come out of the rest — and most of that is not really cuttable either: contractually-owed debt payments (~$3.0M), pensions and insurance and benefits (~$3.3M), and mandatory county and state charges. What is genuinely left — the part a town can cut without breaking a contract or a law — is its discretionary services: general town government, police and fire, public works, human services, and culture and recreation (the library, parks). Together those run about $10.1M a year. (These are the state “Schedule A” service functions; even within them some cost is contractual salary or state-mandated, so the genuinely cuttable amount is somewhat less than $10.1M.)
So the honest way to read the leftover is as a share of that ~$10.1M of cuttable services:
- ~$2.2M (wealth floor + every Town lever) is about a fifth of discretionary services — override-and-trims territory.
- ~$4.4M (wealth floor, no Town levers) is over a third — severe.
- ~$6.0M (no district change, every Town lever) is nearly three-fifths.
- ~$8.2M (no district change, no Town levers) is roughly four-fifths of every discretionary service the Town runs — not survivable as a functioning service town, no matter how many revenue levers are pulled.
What a cut of each size is comparable to
To feel these sizes it helps to set them against real parts of the Town budget — not as proposals, but as yardsticks for the size of the hole. (Every figure below is Great Barrington’s actual FY2025 spending on that function.)
- A ~$2.2M cut is on the order of the Town’s entire Public Works budget (~$2.1M) — or about three times its whole Culture and Recreation budget (library + parks, ~$0.7M), or about three-fifths of the Public Safety budget.
- A ~$4.4M cut is comparable to twice the entire Public Works budget (~$4.3M) — or Public Safety plus Culture and Recreation combined (~$4.5M).
- A ~$6.0M cut is on the scale of Public Safety plus Public Works plus Culture and Recreation combined (~$6.6M) — well over half of every service the Town discretionarily funds.
- A ~$8.2M cut is most of everything: the Town’s entire discretionary service base is about $10.1M, and $8.2M is roughly four-fifths of it — police, DPW, the library, parks, and general government together, most of the way gone.
These are comparisons of scale, not recommendations. Which services a town would protect or reduce is the town’s decision; the point here is only that the hole, at the larger magnitudes, is the size of whole departments.
The bottom line — cuts alone can’t do it
Every budget carries marginal trims and efficiencies, and those are always part of the picture. The finding here is narrower and structural: a multi-million-dollar residual of this kind cannot be closed by cuts alone without cutting into core services — because the Town’s largest cost, the school assessment, is off the table for cuts, so the entire burden falls on the smaller discretionary remainder. That is exactly why the size of the leftover is set primarily by the regional apportionment decision, and only secondarily by how hard the Town works its own levers — and why the Town’s strongest position is to pull its own levers and press the regional fix, not rely on either alone. (Stated as the arithmetic of the situation; which levers to pull, whether to seek an override, and what to cut are the Town’s decisions.)
A related false economy — holding down wages
Holding raises to 2% looks like savings; against inflation of 3.5–4.2% it is a real pay cut of one to two points a year, compounding — sharper still where housing, food, and fuel run above the national average. The predictable result is a workforce that erodes: recruitment and retention fail at municipal pay scales set well below market for the roles hardest to fill. Suppressed pay is not free savings but deferred cost — paid later in turnover, vacancies, and catch-up. Like across-the-board cuts, it is an obvious lever that does not reach the structural driver and carries its own bill.
The politics of the ask
None of these levers eliminates the need for a future Proposition 2½ override. The structural gap is larger than self-help can close, and even the compromise apportionment floor leaves a residual — an override is still the likely endpoint. What the levers change is its size and its politics, and after May 2026 both matter.
The May 2026 override — a $2M request — failed 631 to 397, roughly six in ten against. That margin reads less as a verdict on a single number than as a statement that the Town had not yet earned the ask. And a no vote on a few-hundred-dollar bill is not always a verdict on the number; from a household with no slack left, it is the only lever it has. That is the context every future request now enters. Pulling these levers first is how the Town earns it: collecting the personal-property tax already owed, recovering unbilled excise, capturing new growth, examining the Simon’s Rock exemption, and pressing the regional apportionment that actually drives the gap. Each is the Town doing what it can before asking taxpayers to do more — and each dollar raised or recovered is a dollar the eventual override does not have to carry, leaving a smaller, more defensible ask.
The residential exemption changes the arithmetic most. Because §5C cuts the bill for most owner-occupants — the median home by about $1,629 a year — a right-sized override layered on top of it could net to no increase, or even a decrease, for a large share of resident voters, with the override’s cost falling disproportionately on the non-resident and high-value property the exemption shifts toward. An override that leaves the typical year-round homeowner flat or better is a fundamentally different proposition at the ballot box than one that raises every bill. The sequence follows from that: exhaust the self-help levers and adopt the exemption first, which both shrinks the override and supplies the goodwill — and the no-tax-increase math — to carry a right-sized one. (Offered as fiscal analysis of how the levers interact with override dynamics; the decision to seek an override, and its design, rests with the Select Board and the voters.)